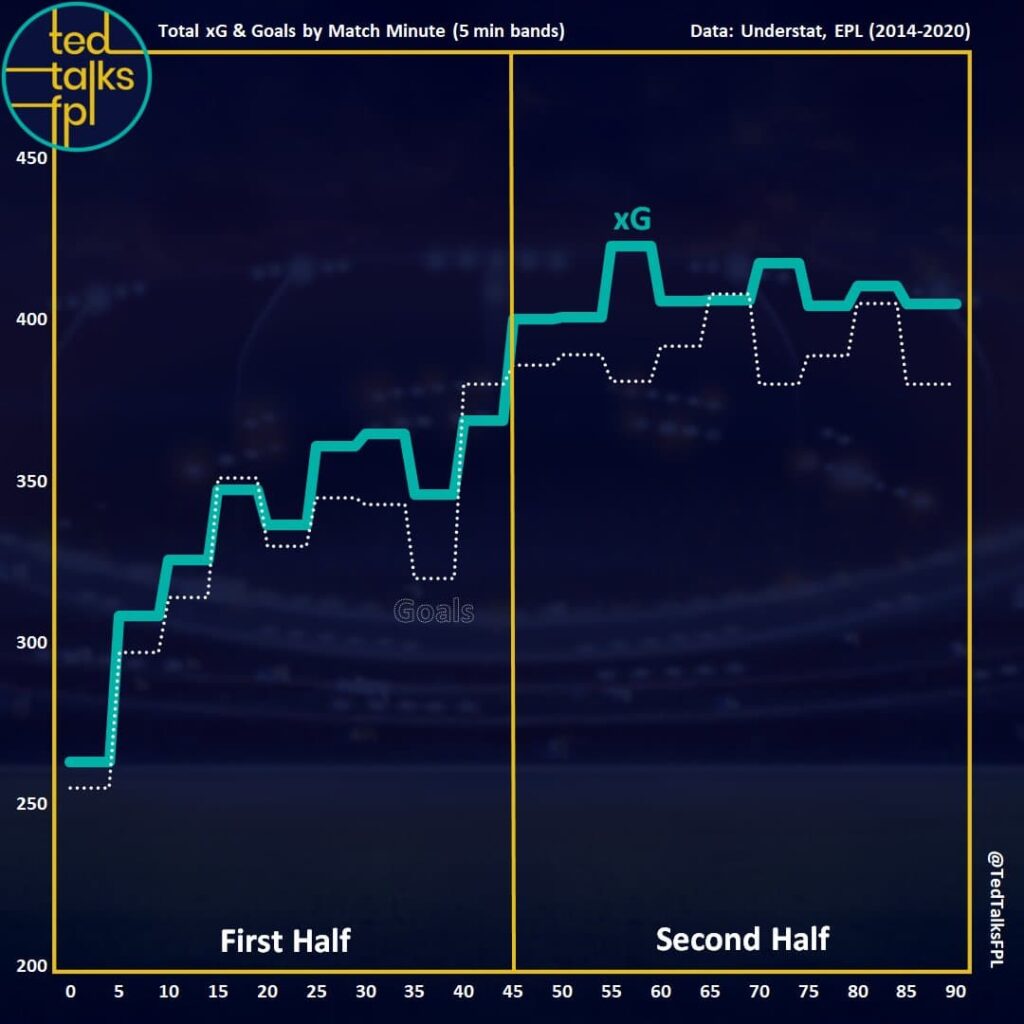
For this study, I obtained multiple seasons’ worth of Premier League data and analysed 60,000+ shots from 2,000+ matches to understand when expected goals (xG) are accumulated and goals are scored during a typical game of football.
It appears that the second half of games is where the action happens; 15% to 20% more goals and xG registered than in the first half.
The bookies already know this, offering odds at 2/1 for ‘most goals in the first half’ and just evens for ‘most goals in the second half’.

How does this affect us as Fantasy managers?
Whenever you use an ‘xG per 90’ stat, you are adjusting a player’s xG by the number of minutes they’ve played. If they’ve played fewer than 90 minutes, you are uplifting that player’s xG to a level that assumes they played the whole game.
READ MORE: FPL tools: Tips on how to use the ‘per 90’ filter
But we’ve just seen that not all minutes in a game are equal in terms of scoring opportunity. In the first half, both sides perhaps have more energy, eager to execute their respective game plans – but once those elements start to wane for one side, that’s seemingly when more chances are afforded.
Therefore, when players start but are taken off at 60 minutes, they are missing the best bit of the game; any xG per 90 stat would under-represent what they could have achieved. Conversely, a player introduced on the hour mark is playing at a time with more xG and any adjustment would over-represent his level of xG if he played a full 90 minutes.
A real-world example of the last sentence is Darwin Nunez (£9.1m) against Fulham in Gameweek 1. He was subbed on at peak xG time and registered 0.7 expected goals. That would take his xG per 90 to 1.43: in theory, the extra 0.73 would have been difficult to obtain in the first half of a game due to the game state.
Proposed Solution
If you know a player has been subbed on or off in various situations over your data period (e.g. the last six Gameweeks), then adjust the ‘xG per 90’ by +15% to +20% for every game he didn’t play the last half an hour and reduce the xG per 90 by -15% to -20% for every game he didn’t play in the first half.
Other than the xG per 90 ‘fix’, it also emphasises how important it is to own players that play 90 minutes, whilst having your player benched and subbed on at 60 minutes isn’t the worst thing ever.
Caveats
This is just averaged information – it doesn’t necessarily represent what will happen in one single game of football. Over a longer period though, it’ll be more representative.
This tweet below from Son of a corner is an example of the volatility in the xG timelines from Gameweek 1:
Catch Ted every week over on our YouTube channel.

