
As some Premium Members of Fantasy Football Scout have picked up on already, Opta’s expected goals (xG) model has had a revamp.
A decade on from when it first appeared the divisive metric, championed by our Career Hall of Fame No 1 Fábio Borges, has become firmly established in the Fantasy Football conversation.
It’s the only stat I use (along with xA) when making FPL decisions. Of course, it is not perfect but if the model is reliable – and you know how to interpret it – I believe it is, by far, the most useful stat for FPL.
In essence, all stats in football aim to tell the story of the match.
While the only one that really matters is goals scored, knowing the number of shots a team had can tell you a little more about what happened in the game – was it a dominant performance or a smash and grab?
Expected goals adds colour to that picture by looking at the type of shots taken.
If one team was restricted to lots of efforts from distance but gave up a glorious chance on the counter, then expected goals will help paint a more nuanced depiction.

Context is everything
With the release of xG 2.0, expected goals has become better at evaluating the quality of a single shot.
It now considers over 35 contextual factors. The most significant improvements are the inclusion of goalkeeper position, defensive pressure and shot clarity.
And, in a move that will please its detractors, Opta has removed ‘big chances’, previously used as a proxy to estimate those details.
The definition of a big chance begins “a situation where a player should reasonably be expected to score” and left it open to criticisms of subjectivity:
… it’s hard for me to believe that there would be zero outcome bias, that a shot being scored wouldn’t make the preceding chance look bigger.
– Michael Caley
Those concerns are no longer an issue.
A more accurate picture
On Fantasy Football Scout, the expected goal values for this season have all been updated to the latest model. Let’s take a look at a few examples to see how they compare:

Firmino v Watford
(see video link to Liverpool YouTube channel)
The chance above has the highest probability of resulting in a goal of any shot this season. Firmino is central, inside the six-yard box and the goalkeeper is stranded.
According to the updated model, the Brazilian would score 96 per cent of the time. A more intuitively satisfying result than the 81 per cent (0.81 xG) it received under the old model.
But why not 100 per cent? Could he really miss from there?
Well, remember expected goals doesn’t account for who takes the shot, so while Firmino may not have missed others have fluffed similar opportunities. Just ask Nathan Redmond, Timo Werner or Cristiano Ronaldo.

Likewise, goalkeeper position and the absence of defensive pressure boosted the likelihood of a goal from around 47 per cent to over 87 per cent in these strikes from James Maddison and Patson Daka.
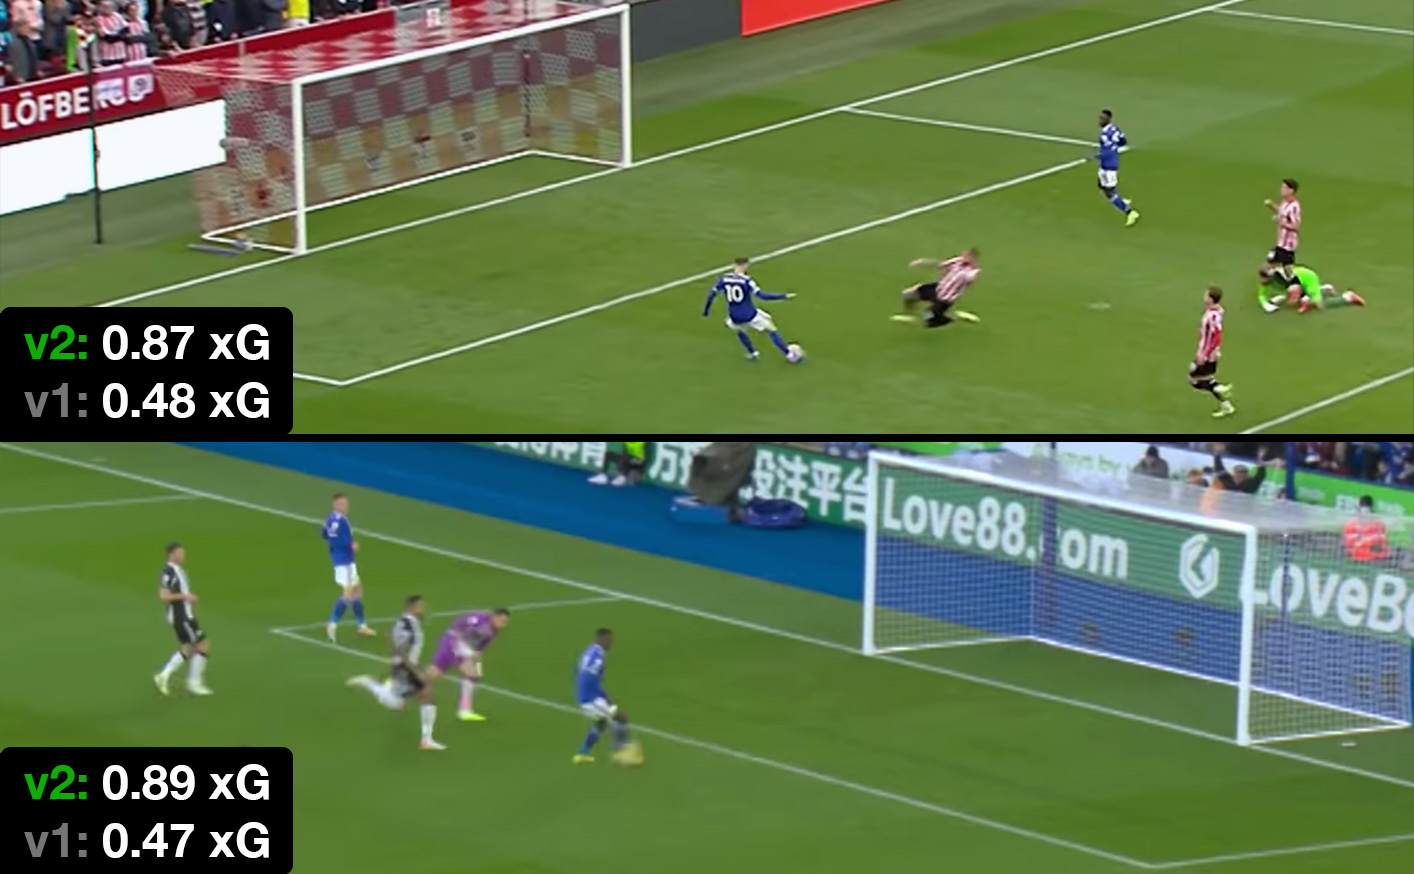
Maddison v Brentford and Daka v Newcastle
(see video links to Leicester City YouTube channel: BRE, NEW)
Equally, some opportunities are now deemed harder thanks to the new contextual factors.

Richarlison v Wolves
(see video link to Wolves YouTube channel)
Richarlison was previously given a four in five chance of converting this attempt against Wolves but xG 2.0 puts it closer to one in five thanks to José Sá smothering the shot.
Unusually revealing

Pedro Neto v Leicester City
(see video link to Wolves YouTube channel)
The most dramatic change in xG value, however, is found in a long-distance effort from Pedro Neto, which had nearly a 19-fold increase from 0.035 to 0.656.
There will always be differences of opinion when it comes to single-shot xG – and the outcome could be affecting our perception of its quality – but if that chance was played out a thousand times, would you expect 656 goals?
Admittedly it’s a little unkind to Opta to pick out this one unusual example from the 6,899 non-penalty shots so far this term – it’s clearly an outlier, Kasper Schmeichel is 30 yards off his goal line – but doing so is revealing.
When factoring in goalkeeper position, Opta measure the distance to goal, distance to the shot, the distance from striker’s line of sight and the ‘keeper’s angle to the shot.
As the improvements in xG 2.0 demonstrate, the strength of any expected goals model depends upon the variables it is taking into account.
That the new variables have upped the likelihood of Neto scoring from less than one in 25 to two in three shows the massive difference contextual factors can make. But could adding more data points further enhance the descriptive power of the model?
Aiming for perfection

Sadio Mané v Leeds United
(see video link to Liverpool YouTube channel)
This miss by Sadio Mané is rated the fourth worst this season, with an 83 per cent chance of a goal being scored.
If you look closely, however, you’ll notice that Jota’s pass takes a deflection off Meslier so at the last second Mané has to adjust his stride to reach the ball.
This information is not currently considered by xG 2.0, and, in my opinion, makes it a much harder opportunity than it first appears.
Despite taking into account details like which foot the player used to shoot, what type of chance it was, and the type of assist that created the opening, recording last-second deflections or the ball going slightly behind the striker may improve expected goal values even more.
It might not be perfect, as Fábio said, but if you know how to interpret it, it’s the most useful stat for FPL.
Best performers
The table below shows the top ten players for non-penalty expected goals to Gameweek 28.
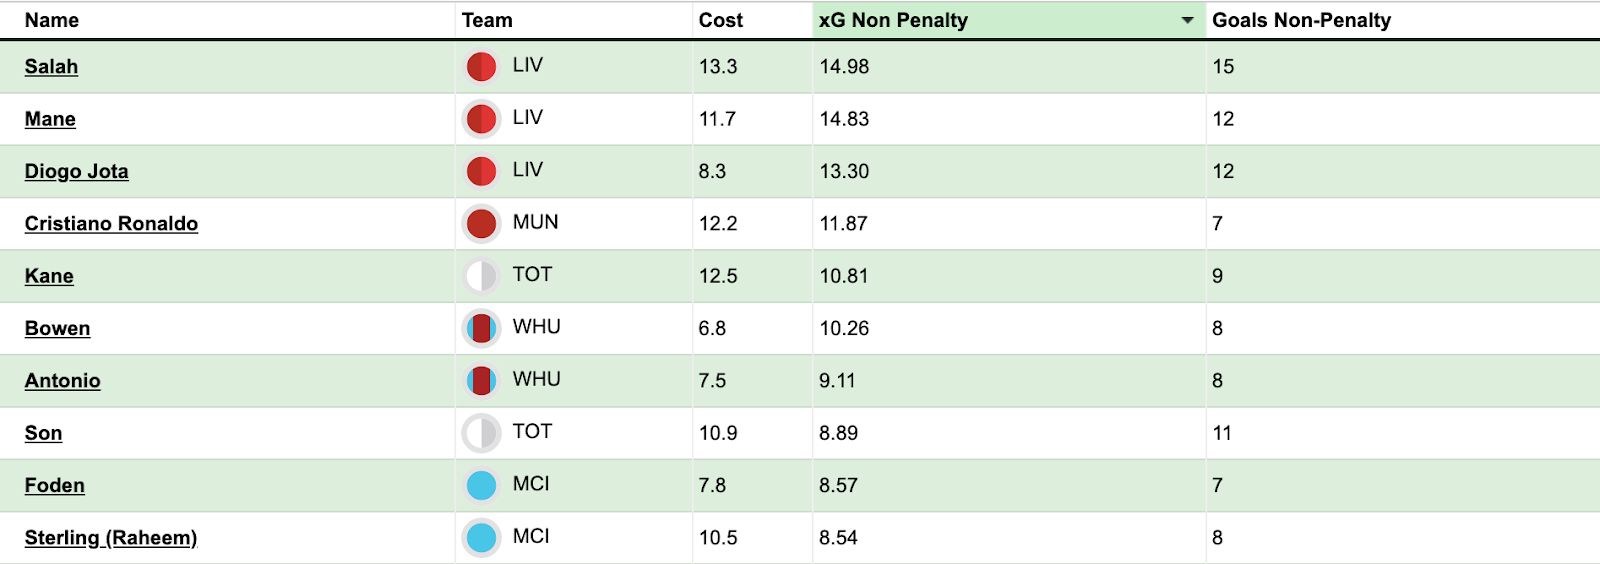
Aside from Son Heung-min and Mohamed Salah, the top ten have scored fewer goals than expected.
But this isn’t due to rebounds inflating xG totals, a concern voiced by Bowstring The Carp among others.
Bowstring rightly points out that it isn’t possible to score more than one goal from a single phase of play.
For example, against Leicester in Gameweek 20, Salah’s penalty was saved, he then headed the follow up against the bar and volleyed the subsequent rebound wide. All in the space of three seconds.

Taken individually, those three shots had a cumulative xG value of 1.84 made up of 0.79 for the penalty, 0.54 for the header and 0.51 for the volley.
Salah’s xG, however, is adjusted to account for the same pattern of play.
So instead of 1.84 being added to his season total, only 0.95 is counted. This gives a wholly more realistic expectation of the number of goals he should have scored.
Cumulative xG
There are situations when you might prefer a cumulative xG total to Opta’s adjusted tally. Measuring finishing ability for instance.
Why is it better to look at cumulative xG for finishing ability? Because each chance should be considered individually.
Ask yourself – if Salah was presented with that second rebound a million times, would you expect him to miss on nine out of ten occasions? Or is scoring one in two more realistic? Probably the latter.
The table below looks at which players get the best quality shots, excluding penalties.
| Player | Shots | Cumulative xG | xG per Shot |
|---|---|---|---|
| Raheem Sterling | 42 | 9.17 | 0.22 |
| Diogo Jota | 64 | 13.68 | 0.21 |
| Sadio Mané | 76 | 14.88 | 0.20 |
| Phil Foden | 46 | 8.82 | 0.19 |
| Joshua King | 47 | 8.22 | 0.17 |
| Conor Gallagher | 41 | 6.65 | 0.16 |
| Son Heung-Min | 55 | 8.90 | 0.16 |
| Mohamed Salah | 100 | 15.87 | 0.16 |
| Cristiano Ronaldo | 77 | 12.08 | 0.16 |
| Jarrod Bowen | 66 | 10.26 | 0.16 |
Raheem Sterling tops the list with an average of 0.22 xG across his 42 shots. Meaning, we’d expect him to score at a better rate than one in five.
In fifth place, we find Joshua King, who averages 0.17 xG per shot. But as any frustrated owner will tell you, this doesn’t mean much given his finishing ability this season.
Interpreting player performance
| Player | Shots | Cumulative xG | xG per Shot | xG per Goals | Goals |
|---|---|---|---|---|---|
| João Cancelo | 59 | 3.34 | 0.06 | 3.34 | 1 |
| Bryan Mbeumo | 46 | 6.00 | 0.13 | 3.00 | 2 |
| Gabriel Jesus | 41 | 5.50 | 0.13 | 2.75 | 2 |
| Adam Armstrong | 44 | 4.75 | 0.11 | 2.37 | 2 |
| Joshua King | 47 | 8.22 | 0.17 | 2.06 | 4 |
| Cristiano Ronaldo | 77 | 12.08 | 0.16 | 1.73 | 7 |
| Chris Wood | 45 | 6.60 | 0.15 | 1.65 | 4 |
| Leandro Trossard | 57 | 4.54 | 0.08 | 1.51 | 3 |
| Harvey Barnes | 44 | 4.24 | 0.10 | 1.41 | 3 |
| Daniel James | 46 | 5.39 | 0.12 | 1.35 | 4 |
Indeed, King needs, on average, two xG to score one goal ranking him among the poorest finishers in the league.
João Cancelo is deemed the worst, however, scoring just once from an xG of 3.34. Although it’s worth noting that despite taking 59 shots up to Gameweek 28, he’s averaged just 0.06 xG per shot. So his odds of scoring any individual attempt is a lowly six per cent.
In fact, you could make a convincing argument for King being the worst given his impressive xG per shot.
| Player | Shots | Cumulative xG | xG Per Shot | xG per Goal | Goals |
|---|---|---|---|---|---|
| Kevin De Bruyne | 53 | 4.01 | 0.08 | 0.45 | 9 |
| Emmanuel Dennis | 52 | 6.78 | 0.13 | 0.75 | 9 |
| Mason Mount | 46 | 5.29 | 0.11 | 0.76 | 7 |
| Youri Tielemans | 44 | 3.15 | 0.07 | 0.79 | 4 |
| Son Heung-min | 55 | 8.90 | 0.16 | 0.81 | 11 |
| Conor Gallagher | 41 | 6.65 | 0.16 | 0.83 | 8 |
| Bruno Fernandes | 64 | 7.65 | 0.12 | 0.85 | 9 |
| James Maddison | 51 | 6.01 | 0.12 | 0.86 | 7 |
| Demarai Gray | 42 | 4.37 | 0.10 | 0.87 | 5 |
| Riyad Mahrez | 42 | 5.27 | 0.13 | 0.88 | 6 |
Turning to the best finishers, Kevin De Bruyne has scored a goal every 0.45 xG this term. If Raheem Sterling could finish at the same rate he would have 20 goals instead of 10.
But the comparison is unfair – and this is where it’s important to interpret those results.
De Bruyne’s xG per shot is a mere 0.08, and looking at his shot heatmap we can understand why:

Just under half his goal attempts, 26 of 53, have come from outside the penalty area. Sterling, in contrast, has taken just eight of his 42 non-penalty shots from outside the box.

Despite the added contextual factors, distance to goal remains a crucial component of expected goals.
So given his general shot location, De Bruyne is not going to have the same volume of xG as Sterling, despite taking more shots than him.
Indeed, looking at the table of best finishers, there are several players who are good at striking the ball from distance.
This makes sense because scoring with a shot from outside the box will boost your goals to xG ratio. For instance, Youri Tielemans’ belter against Brentford had an xG value of just 0.02.
Equally, missing a long-range effort isn’t going to add much to your xG total.
To me, the two players who stand out from the table of best finishers are Son Heung-min and Conor Gallagher, who combine a high xG per shot of 0.16 with a low xG per goal.
Predicting the future
It’s tempting to look at these tables and think that those who are under or over-performing will regress to the mean.
However, we must beware of Gambler’s Fallacy: the players have already ‘banked’ their over or under-performance. To draw an analogy, if we flipped a coin and (improbably) got ten heads in a row, it doesn’t mean the next ten flips will all be tails.
Nonetheless, it’s worth asking the question: are there players who consistently exceed or fail to reach their expected goals tally?
It’s an idea of Fabio’s that FPL Virgin picked up on in his examination of career xG earlier in the season.
Site improvements
We recently revamped several tabs in our Members’ Player Stats and added to the metrics available in Members’ custom tables. Following Opta’s revamp of expected goals we will be making further improvements.
‘Cumulative xG’ will be added to allow members to make a comparison with Opta’s adjusted xG numbers already on site.
New stats ‘xG per Shot’ and ‘xG per Goal’ will make use of cumulative xG.
There are also plans to incorporate various career metrics. Whether that’s by creating individual stats, such as ‘Career xG’, or by adding an ‘All Seasons’ filter option. Testing will dictate which route is the most effective.


Full-year memberships, monthly subscriptions and a FREE trial are all now available.
Join now to get the following:
- Plot your transfer strategies using the fully interactive Season Ticker.
- Get projections for every Premier League player provided by the Rate My Team statistical model.
- Use Rate My Team throughout the season to guide your selections and transfers.
- Get access to over 150+ exclusive members articles over the season.
- Analyse our OPTA-powered statistic tables specifically tailored for Fantasy Football Managers.
- Use our exclusive tool to build custom stats tables from over 100 OPTA player and team stats.
- Enjoy our Flat-Track Bully feature which introduces an opposition filter to your tables.
- View heatmaps and expected goals data for every player.
- Use our powerful comparison tool to analyse players head-to-head.
ALREADY A USER? CLICK HERE TO UPGRADE YOUR FREE ACCOUNT
NEW TO SCOUT? CLICK HERE TO START A MEMBERSHIP ACCOUNT