Over the summer Fantasy Football Scout entered into partnership with StatsBomb who, like Opta, provide statistics for football matches.
Championed by many in the analytics community, the reason we decided to team up with StatsBomb is that they provide the most granular event data on the market.
From player and defender locations on every shot to pressures, shot height and shot velocity, StatsBomb collects more data points from matches.
This extra context makes their expected goals (xG) model the most accurate and realistic available.
Most Premier League teams, including data pioneers Liverpool, use StatsBomb to help inform player recruitment and team performance.
And Premium Members can now access this data through a series of tables in our Members Area.
This article will take a look at some of the insights we can gain from those tables.
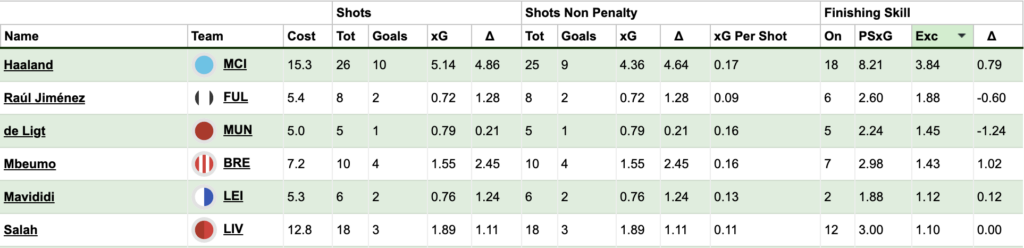
What makes Haaland essential?
Earling Haaland’s (£15.3m) finishing has been outstanding this season.
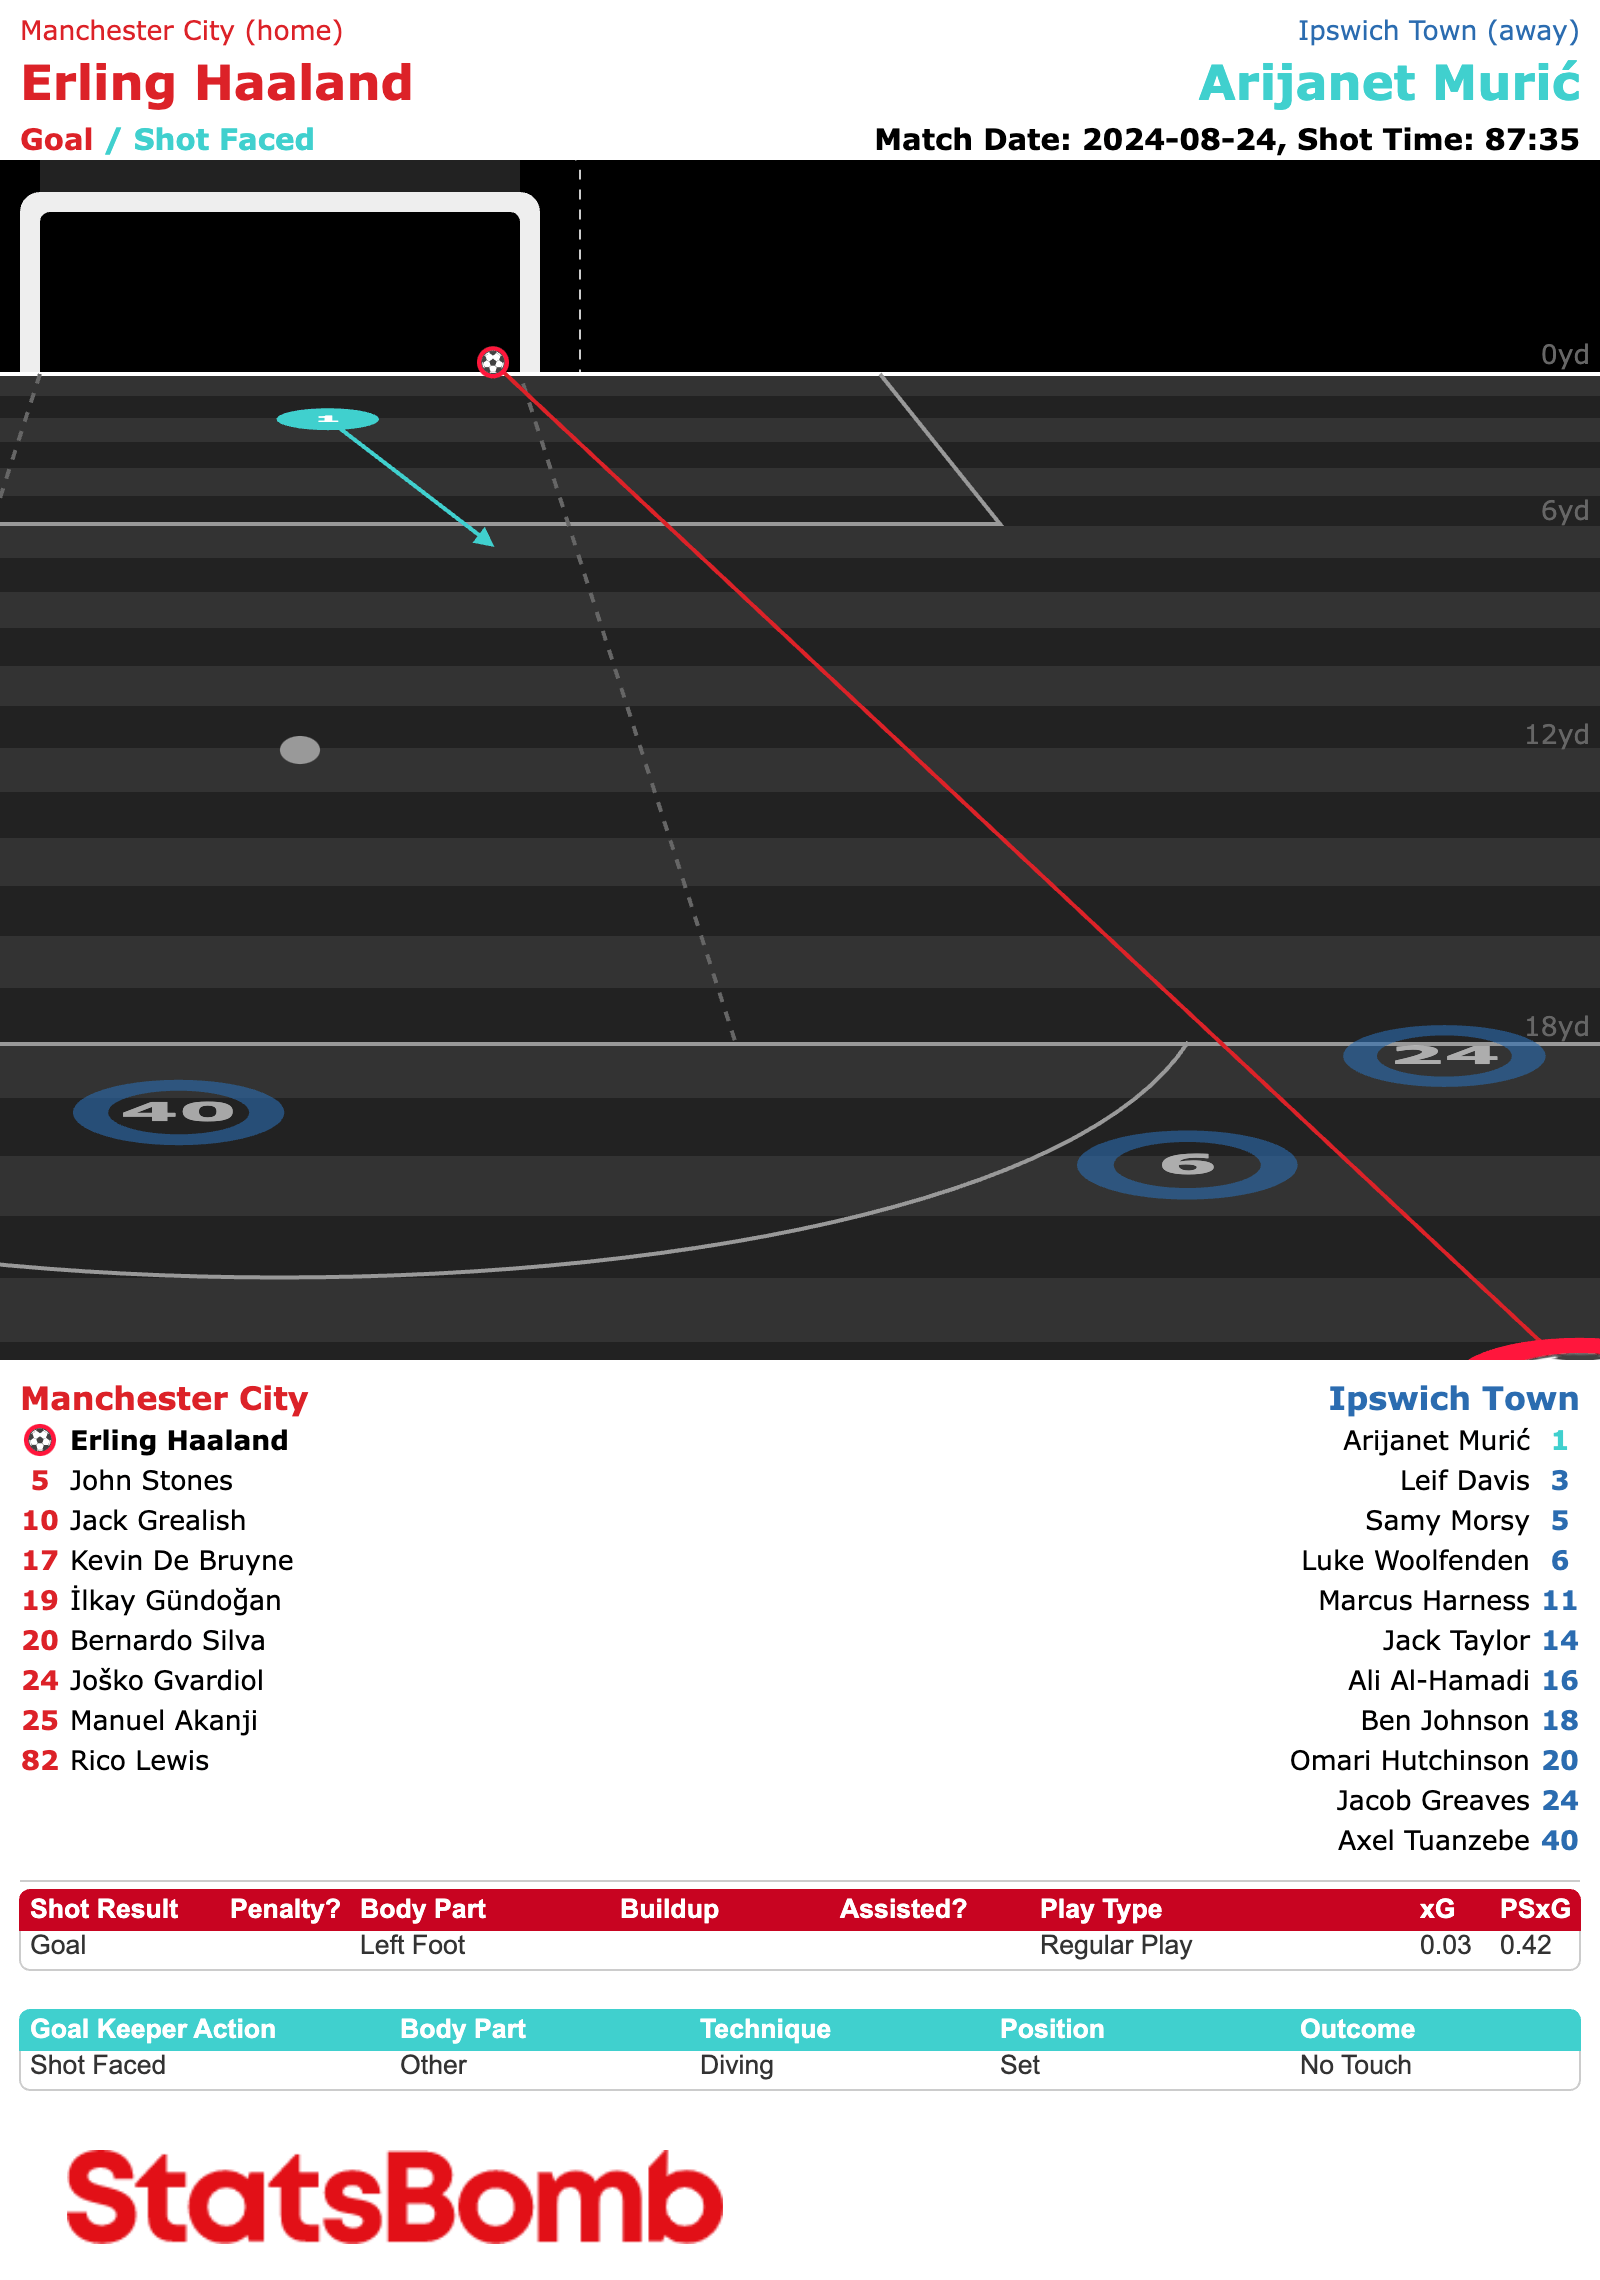
With goals like his third versus Ipswich Town, he’s transformed low-quality chances into good goalscoring opportunities.
The StatsBomb Shots table illustrates this.
His nine non-penalty goals had an xG value of 4.36, but taking into account his clinical finishing ability he’s registered 8.21 post-shot xG.
Expected goals (xG) factors in everything up to the moment of the shot but tells us nothing about the shot itself. In essence, it measures the quality of the chance presented to the player.
Post-shot xG, on the other hand, measures the quality of the shot.
It tells us that when it comes to shot execution, not only has Haaland made the most of the chances that have come his way, but his over-performance is not as great as xG alone would have us believe.
StatsBomb Shots table sorted by “Shot Execution (Post-Shot xG minus xG)”
(click to expand)
Indeed, the 3.84 xG he’s added to his shots is more than double that of any other player.
It’s also notable that Mohamed Salah’s (£12.8m) smaller xG over-performance can also be explained by the quality of his shooting. His three goals match his 3.00 post-shot xG exactly.
Why does this matter?
Well, it tells us that Haaland’s xG over-performance is less about luck, such as goalkeeper or defender errors, and can be attributed to shot execution. If he keeps shooting this well you’d expect him to sustain this level of output, as crazy as that sounds.
Fortunate Finishers
For players such as Jhon Duran (£6.1m), Harvey Barnes (£6.5m) and even Luis Diaz (£7.9m), however, there’s a greater degree of good fortune to their goalscoring.
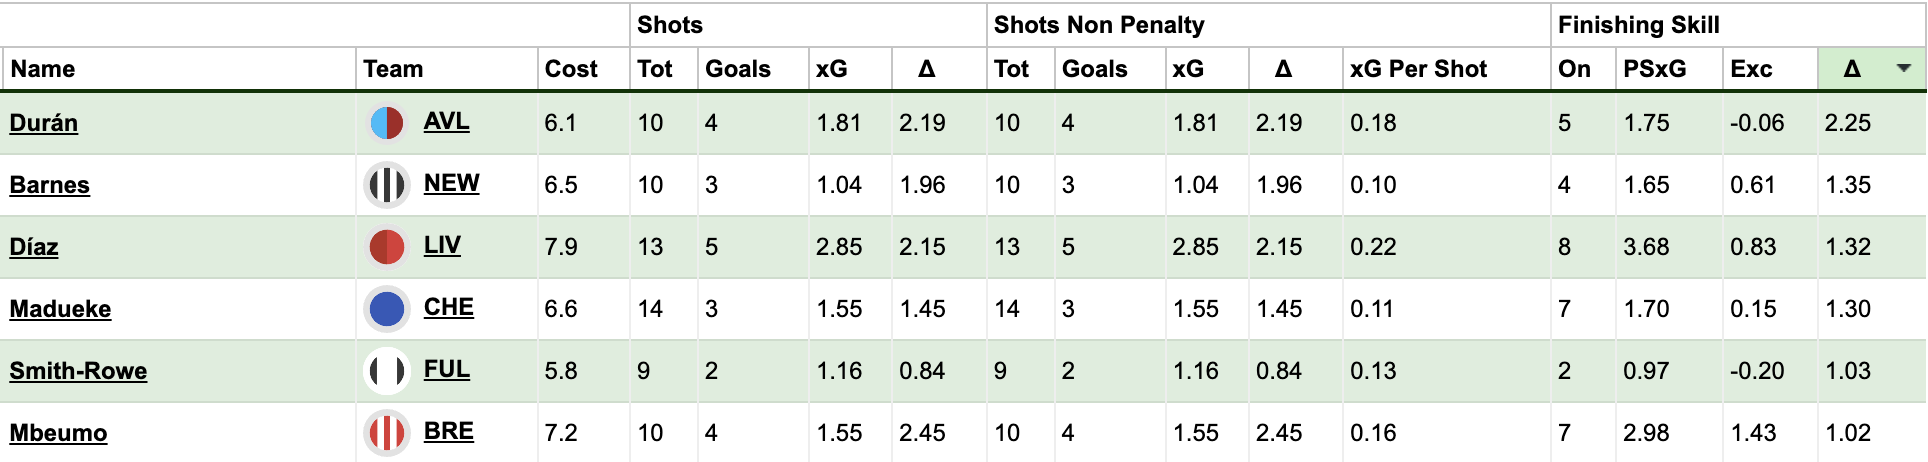
StatsBomb Shots table sorted by “Post-Shot xG Delta (Goals minus Post-Shot xG)”
(click to expand)
Duran has scored 2.19 more goals than his xG would suggest but, despite his rocket against Everton, the goalkeepers and defenders should have done better with those efforts. A 1.75 post-shot xG score is, in fact, lower than his xG total.
And while his international team-mate Diaz has added value to his shooting opportunities, converting 2.85 xG into 3.68 post-shot xG, he’s still scored above expectations.
As Tom pointed out in his analysis on Diaz, high-quality opportunities, Opta-defined “big chances”, have underpinned the Colombian’s upturn in form this season.
Looking at the data available to the editorial team, that’s reflected in the StatsBomb numbers as well.
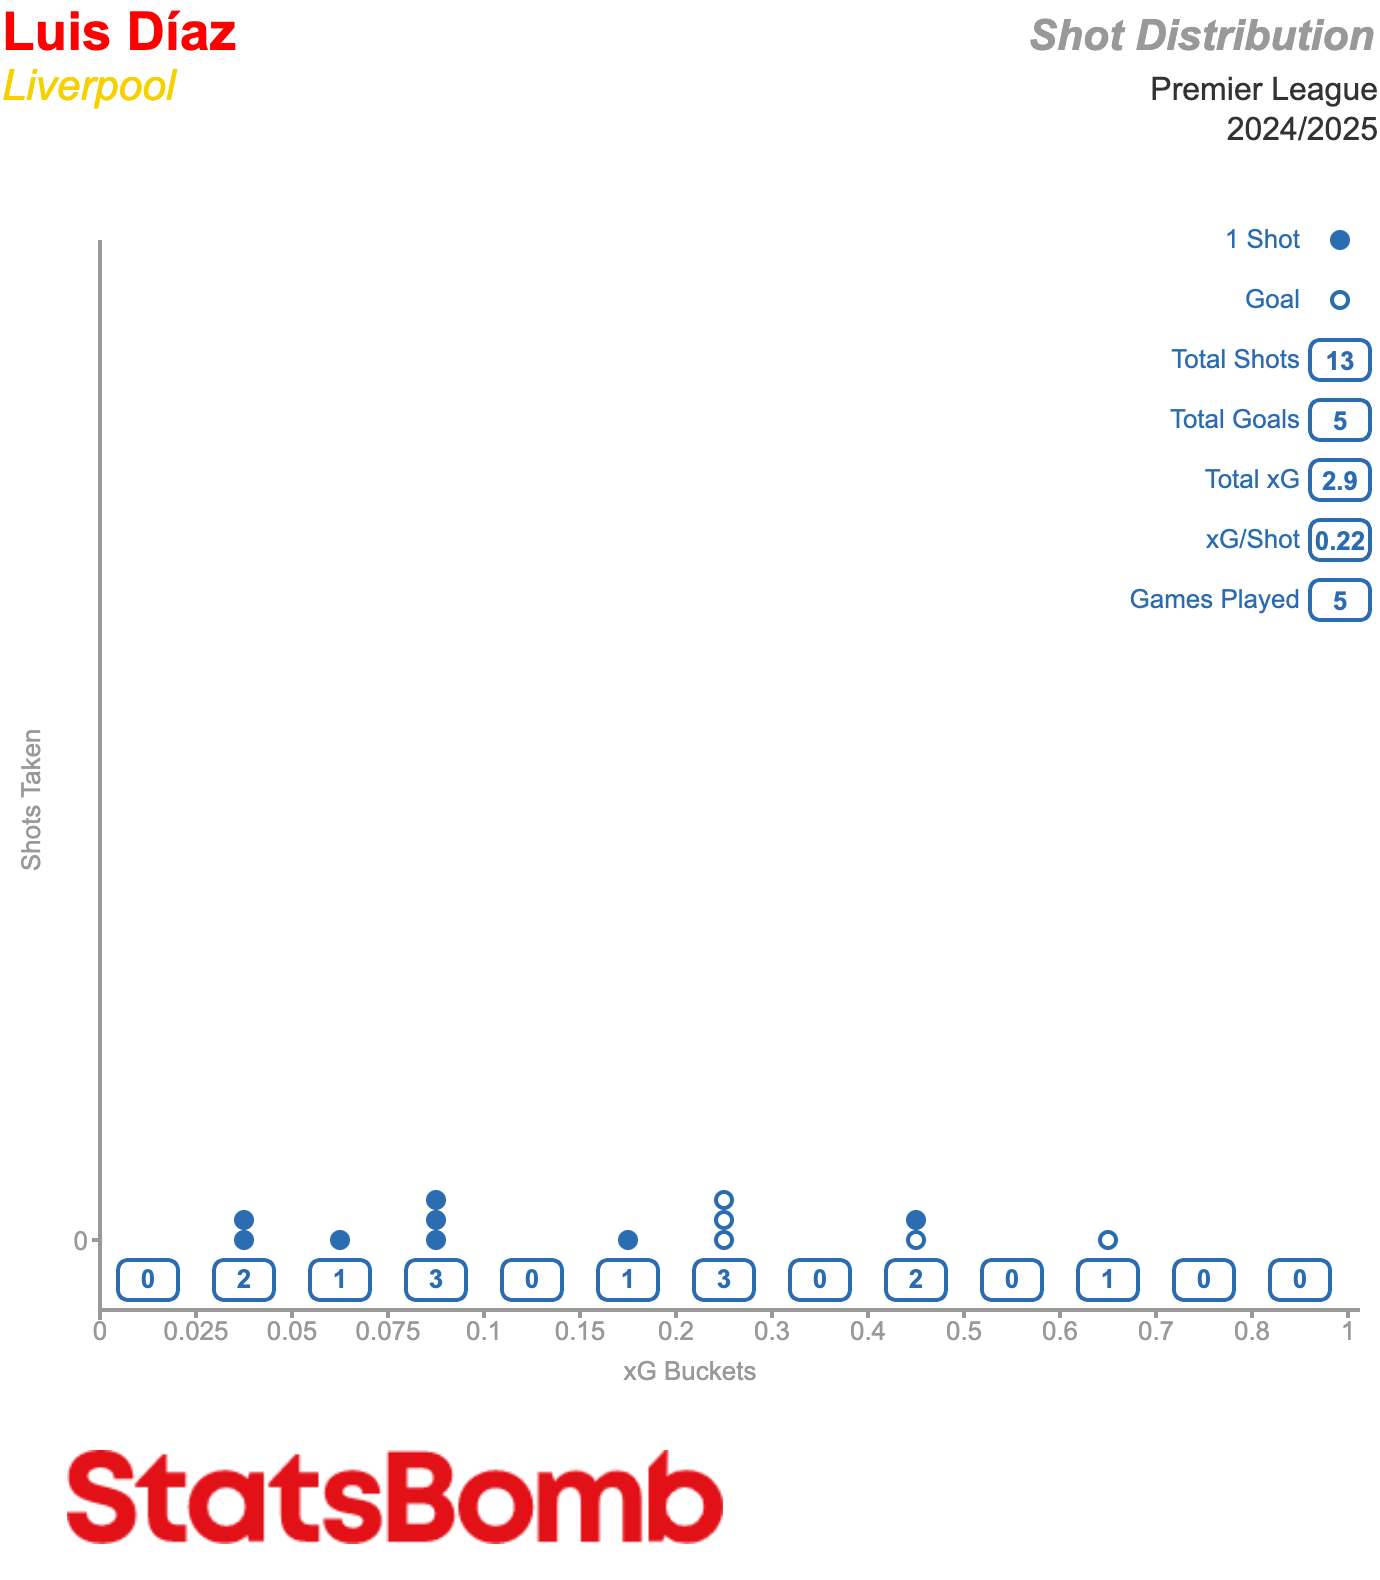
Grouping shots into buckets, Luis Diaz has converted five of his six chances rated at 0.2 xG or above.
Although it’s a small sample size, the distribution of better quality opportunities is evident compared to last season, where the majority of his efforts were much lower quality.
Notably, none of the 48 shots he had below 0.1 xG resulted in goals.
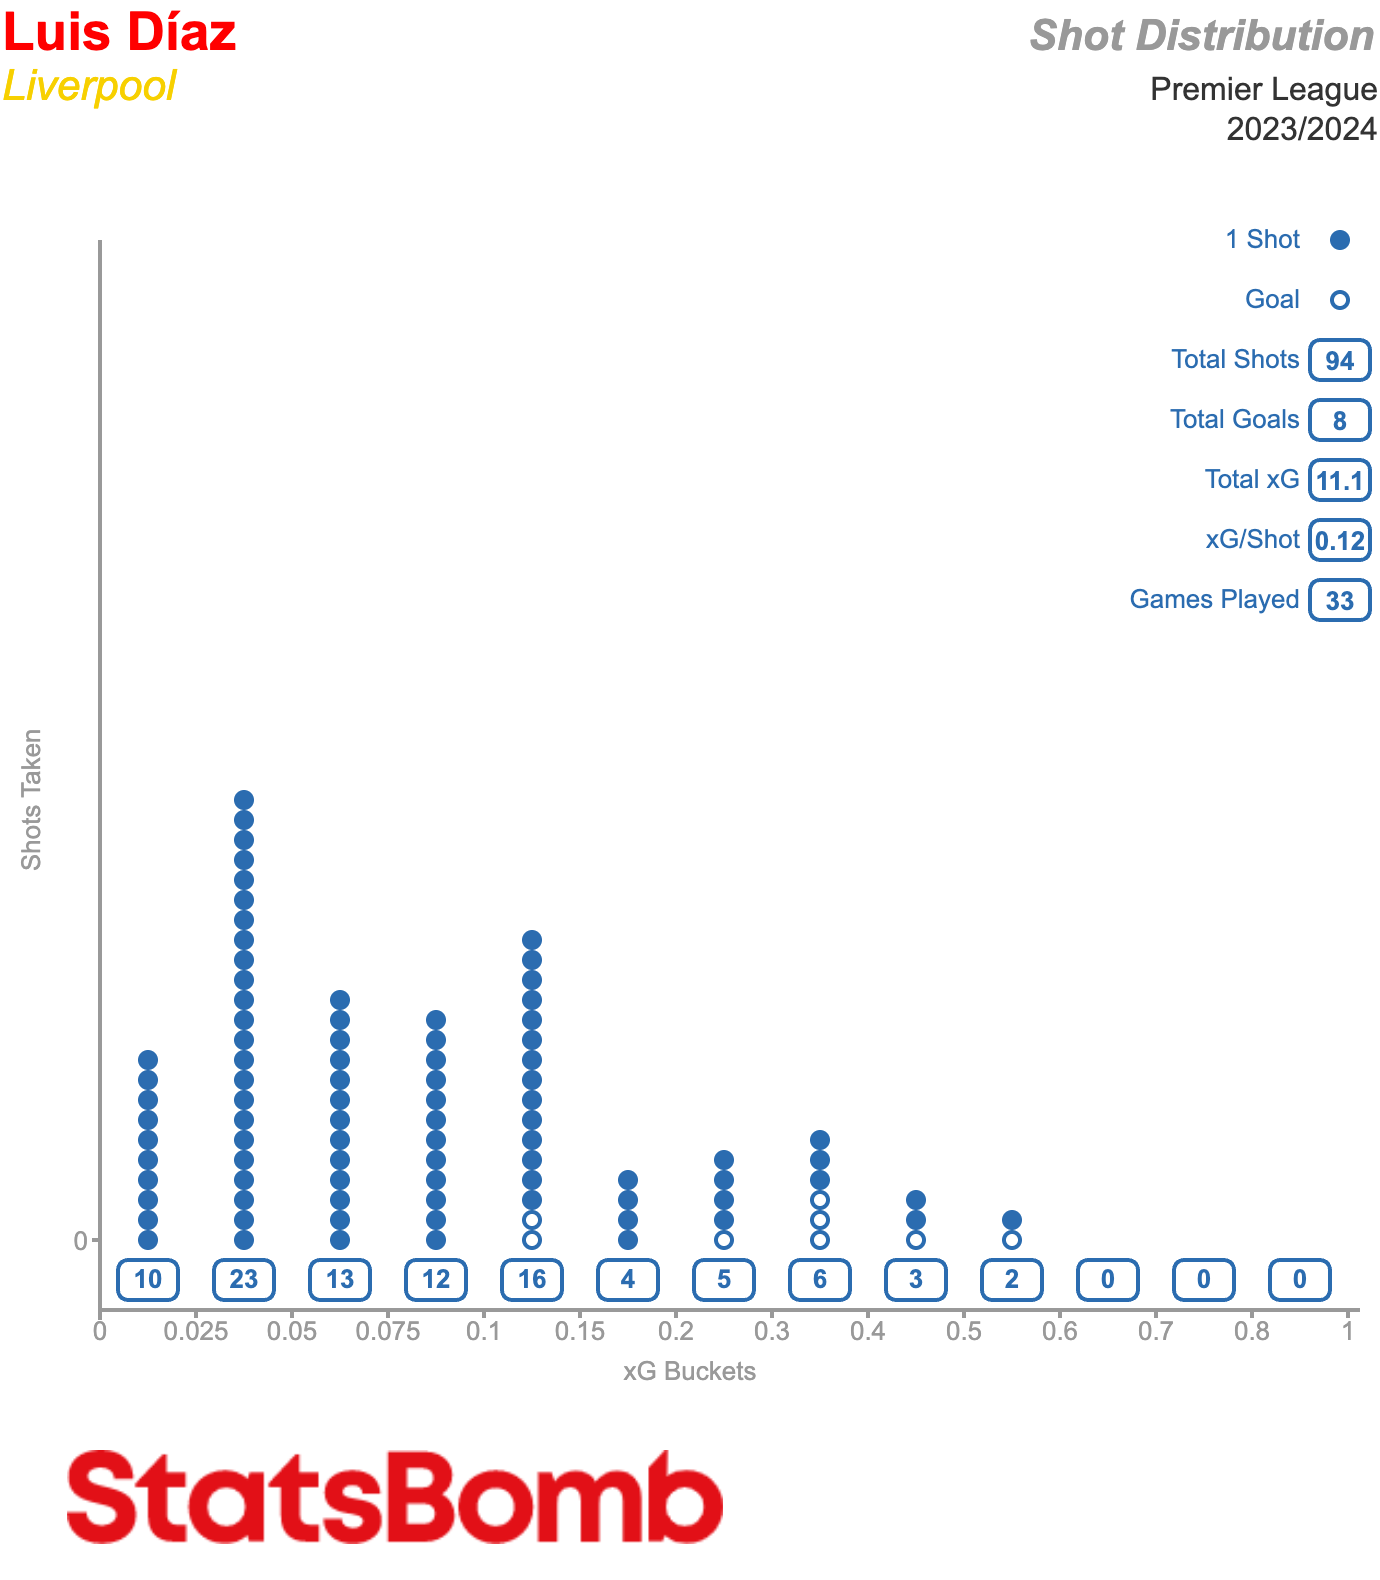
An increase in his xG per shot from 0.12 to 0.22 has helped fuel his explosive start to the new campaign, and a little luck hasn’t gone amiss either.
Under pressure
For those on a Gameweek 6 Wildcard trying to decide what to do with Liverpool players, the serious injury to Yerson Mosquera (£4.0m) means Wolves will be without one of their best performers this season.
No defender has more successful pressure regains than the young Colombian. According to the StatsBomb Pressures table, the cut-price defender has 27 pressure regains, which means Wolves won back possession 27 times within five seconds of Mosquera pressurising an opponent.
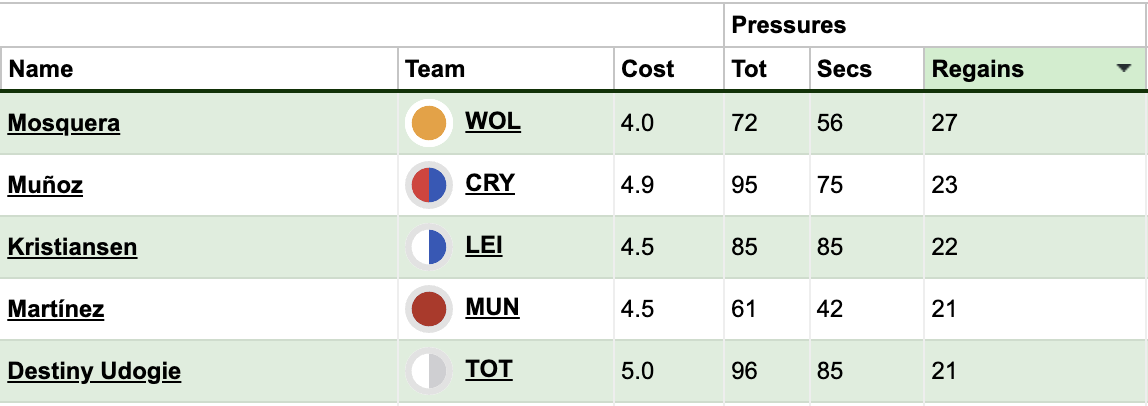
StatsBomb Pressures table sorted by “Pressure Regains”
(click to expand)
A “Pressure” is when a player applies pressure within 4-5 yards of an opposing player in possession of the ball.
Research by StatsBomb revealed that a significantly higher proportion of goals are scored in the absence of pressure than under pressure. From a sample of 46,829 shots, 14 per cent with no pressure applied resulted in goals compared to just seven per cent of shots under pressure.
| Pressure | No Pressure | |
| Goal Conversion Rate | 0.07 | 0.14 |
Mosquera could be sorely missed in other words.
Under the hood
Before we finish, let’s take a deeper look at what goes into StatsBomb’s xG and post-shot xG models.
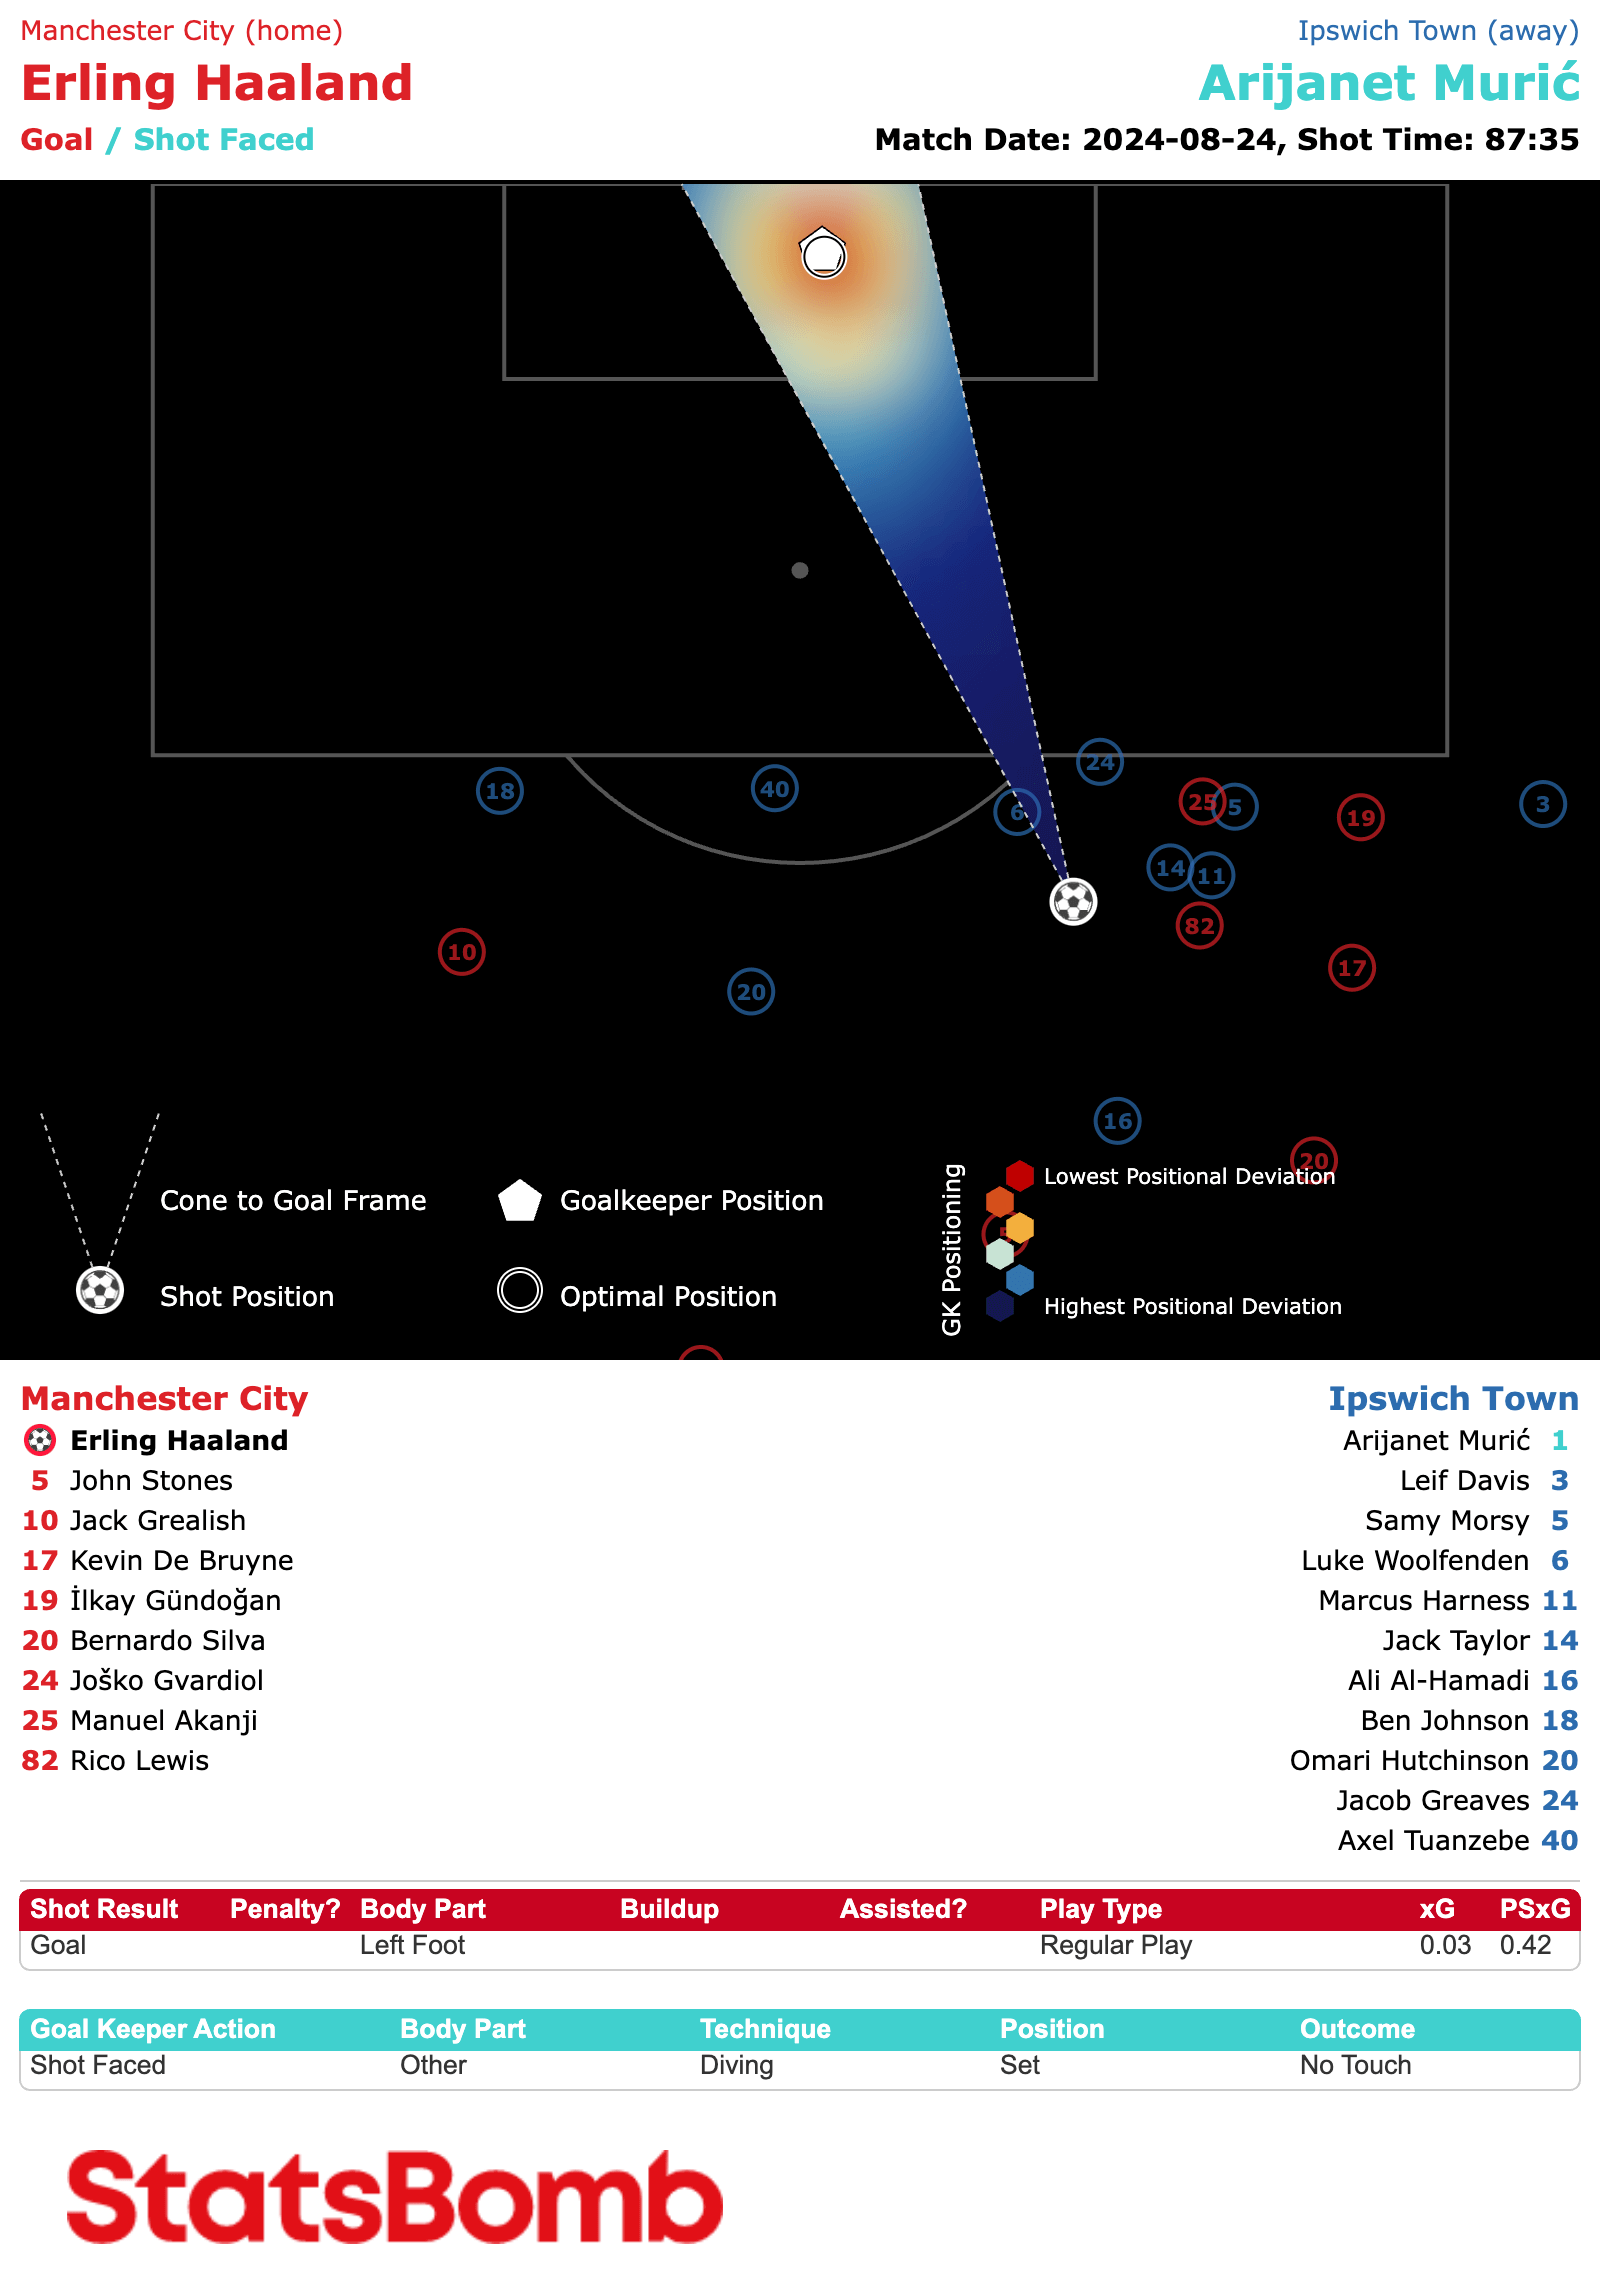
Starting with their Freeze Frames, we’ll examine that third goal of Haaland’s versus Ipswich as an example.
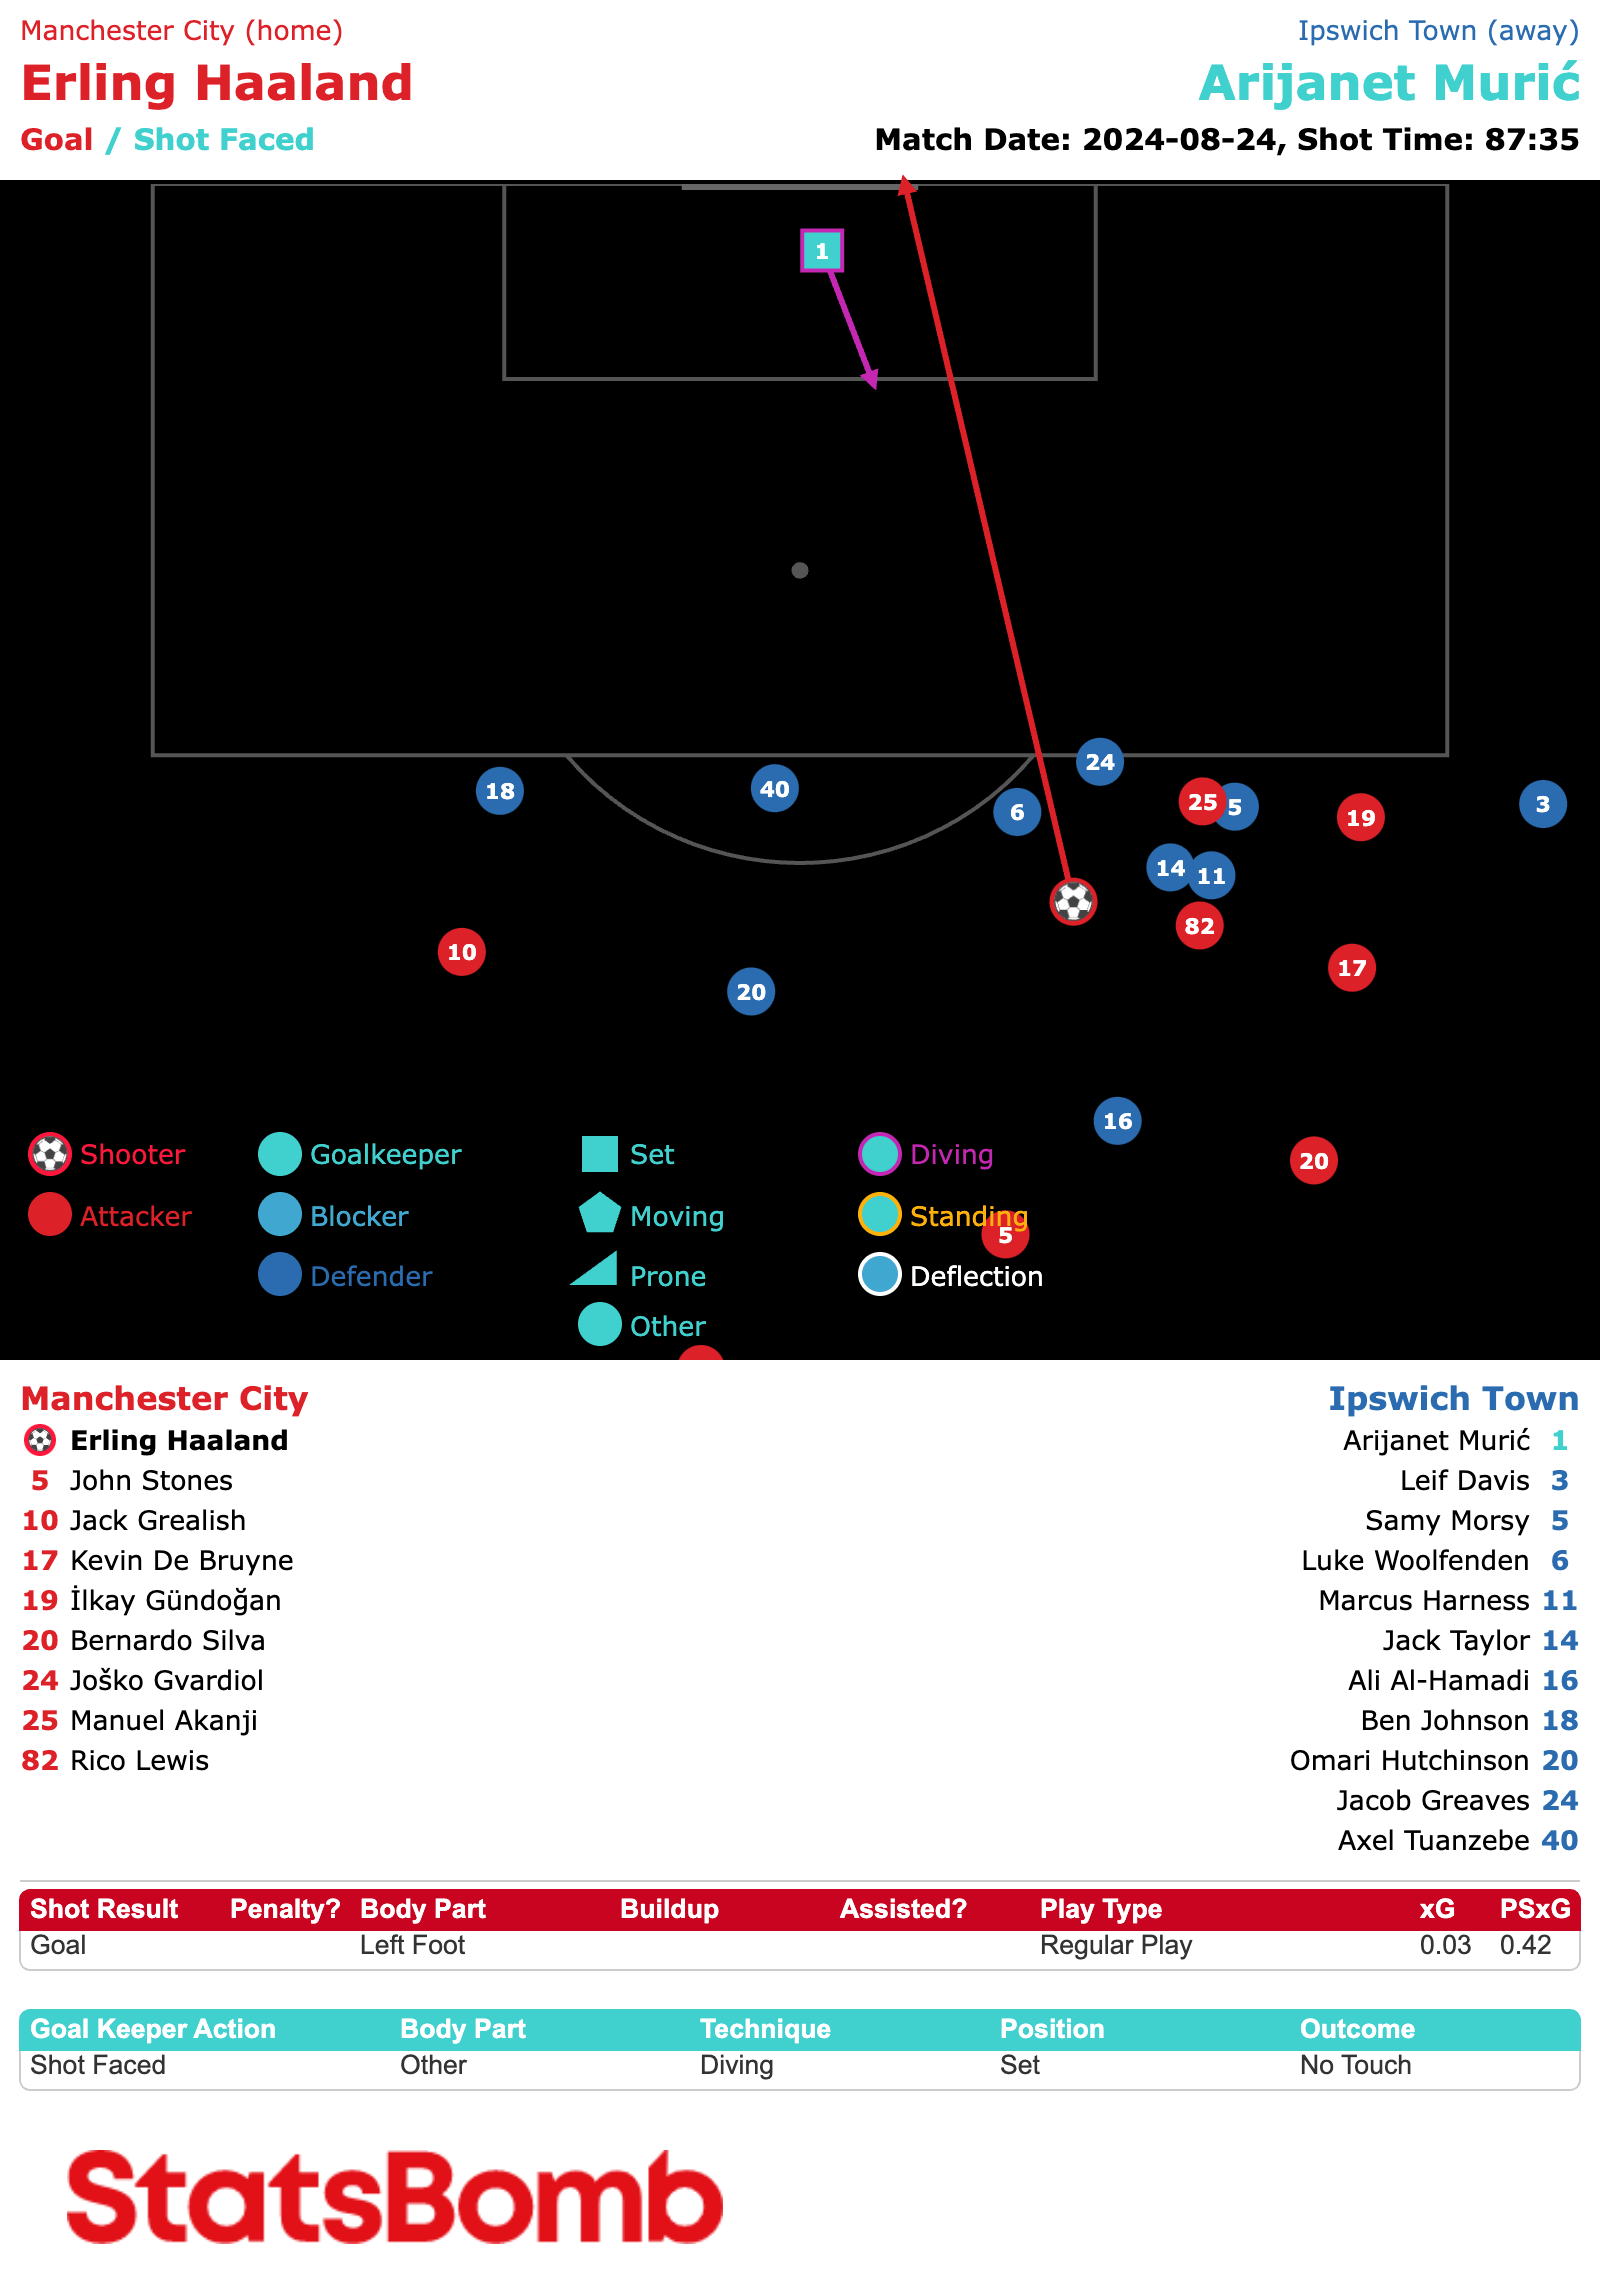
Freeze Frames record the precise defender and goalkeeper locations for all shots. This means StatsBomb can measure things, such as defensive pressure, known to have an impact on the outcome of those chances.
Here’s how the “freeze frame” of that shot looked on video.

StatsBomb’s Freeze Frames also feature a ‘Keeper Cone’ – a triangle drawn between the shot taker and the goalposts to highlight the amount of goal the shot-taker is able to see. Including the proportion of the goalface blocked by the defenders.
Another feature unique to StatsBomb is Shot Impact Height. This is the height of the ball when a shot is struck. Essentially, ground shots are more likely to result in a goal compared to shots around waist height because the technique required is much easier to execute.
These factors and others, such as distance and angle, estimate that Haaland’s shooting opportunity would result in a goal about three per cent of the time (0.03 xG).
But when we include shot placement and shot velocity, the post-shot xG model revises that estimation up to 42 per cent.
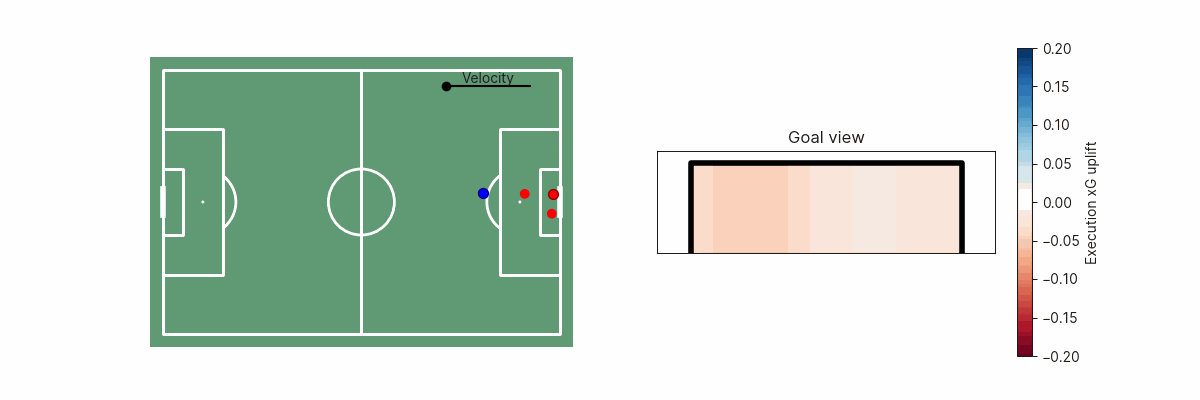
Shot Placement & Velocity
We can estimate the goalscoring likelihood if the shot was placed anywhere along the goal face. This can inform us on whether the shot placement was optimal, or how far off optimality a particular shot was. In simple cases, this may be obvious since shooting towards the corner of the goal furthest from the goalkeeper is the optimal shot, but becomes non-trivial if there are defenders blocking that shot path.
– StatsBomb on the importance of shot placement
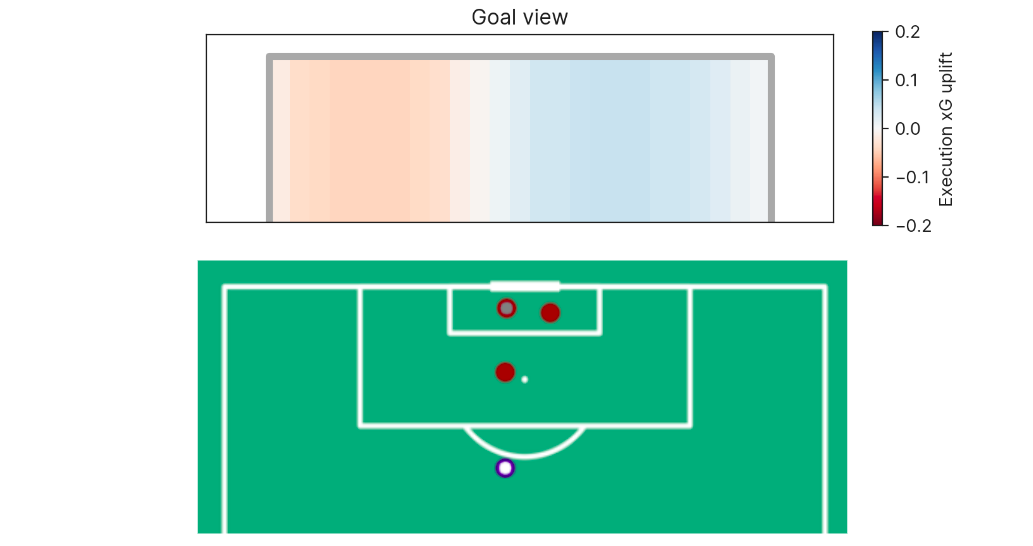
While the amount of the goal the player can see helps to determine the best place to put the ball, the probability of scoring increases the harder the shot is struck. As this GIF below illustrates.
A more accurate picture
One final note — and why we prefer StatsBomb post-shot xG to Opta’s equivalent metric, Expected Goals On Target — is the inclusion of goalkeeper and defender positions.
While Opta upgraded their xG model in 2022 to include ‘keeper location and defensive pressure, it appears their post-shot xG model did not fully benefit from those changes.
It largely looks at where the shot ended up within the frame of the goal. Shots in the corners are given a higher value than shots down the middle. But what if there are defenders blocking the corners? Or what if it’s an open goal?
Take this strike by Gabriel Martinelli (£6.9) in Arsenal’s 4-2 win at Aston Villa in February last year.
Goalkeeper Emi Martinez (£5.0m) has gone up for a corner kick and is stranded as Martinelli breaks away to slot the ball into an empty net.

Opta gave it an xG of 0.98 but their post-shot xG model rated it at 0.68.
It feels rather unkind to knock Martinelli’s finishing down by 0.3 xG simply because his shot ended up in the middle of the goal rather than in a corner.
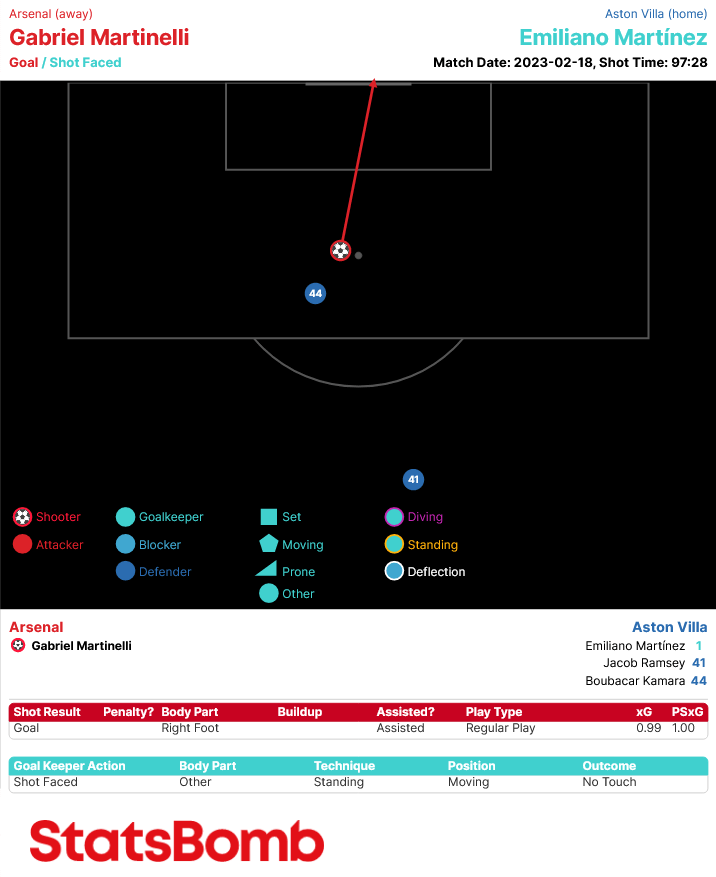
Happily, StatsBomb’s post-shot xG model doesn’t do that, rating the chance at 0.99 xG and the shot at 1.00 PSxG.
It’s this level of granular detail that makes StatsBomb’s expected goals models the best available.
