Mohamed Salah (£12.8m) has always been a key figure since joining Liverpool in 2017.
He continues to be heavily involved under Arne Slot, too, with seven goals and five assists in 10 games this season.
But how good has he been, and is this the best version of Salah we’ve ever seen in Fantasy Premier League (FPL)?
In this Premium Members article, we look at how the Egyptians’ stats compare to previous seasons under Jurgen Klopp.
We’re using not just Opta data from our Members Area but also some Statsbomb graphics, too. This is part of our ongoing partnership with both industry-leading data providers.
GOAL THREAT
| Season | Goals | Shots | Shots in the box | Big chances | Pen box touches | xG |
|---|---|---|---|---|---|---|
| 2024/25 | 0.72 | 3.09 | 2.89 | 1.13 | 9.90 | 0.60 |
| 2023/24 | 0.63 | 4.01 | 3.24 | 1.16 | 9.15 | 0.75 |
| 2022/23 | 0.52 | 3.42 | 2.84 | 0.93 | 9.11 | 0.56 |
| 2021/22 | 0.75 | 4.51 | 3.67 | 1.20 | 10.94 | 0.74 |
| 2020/21 | 0.64 | 3.68 | 2.86 | 0.96 | 9.11 | 0.56 |
| 2019/20 | 0.59 | 4.12 | 3.43 | 0.90 | 10.04 | 0.60 |
| 2018/19 | 0.61 | 3.78 | 2.62 | 0.80 | 8.88 | 0.56 |
| 2017/18 | 0.99 | 4.44 | 3.48 | 1.32 | 8.69 | 0.75 |
The underlying goal threat stats suggest there’s not much difference from previous seasons.
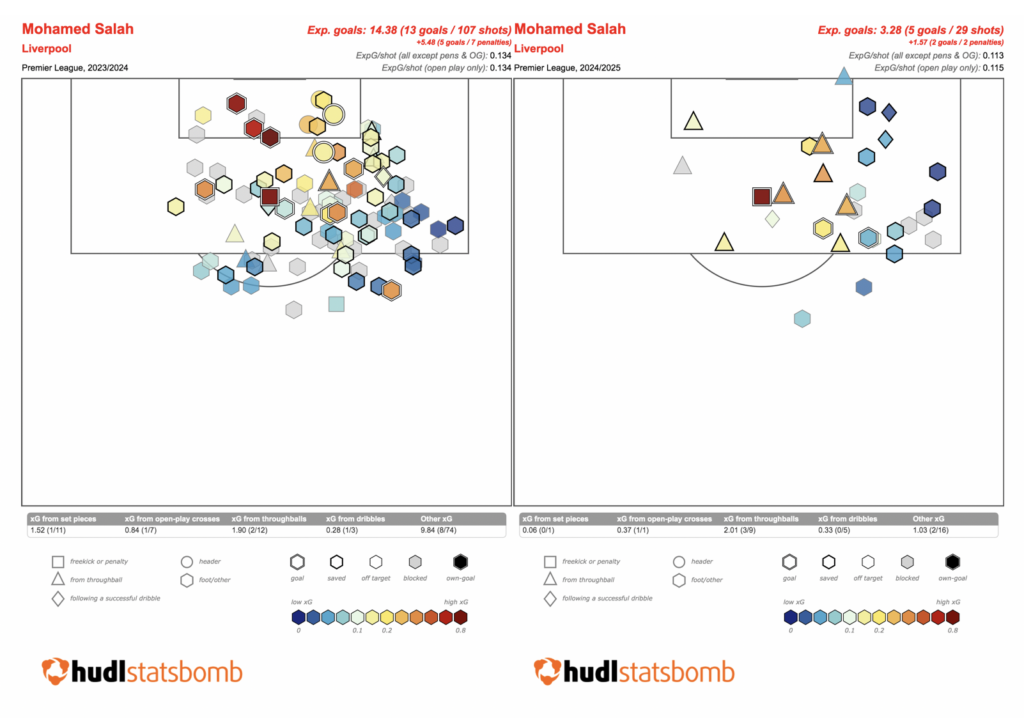
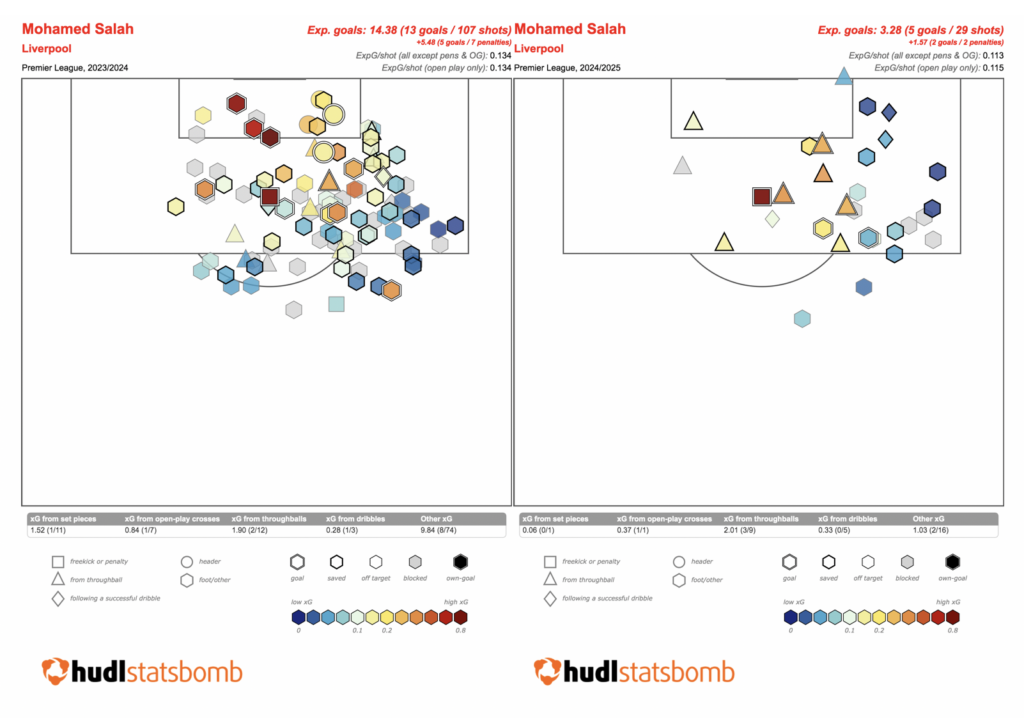
When compared to Jurgen Klopp’s final season in charge, Salah is slightly down for shots, shots in the box, big chances and expected goals (xG) per 90 minutes (p90).
However, his conversion rate is up.
In 2023/24, it was 15.8%. This season, he’s currently converting 23.3% of his shots, a significant hike.

Above: Mohamed Salah’s shot maps in 2023/24 (left) and 2024/25 (right), via StatsBomb

