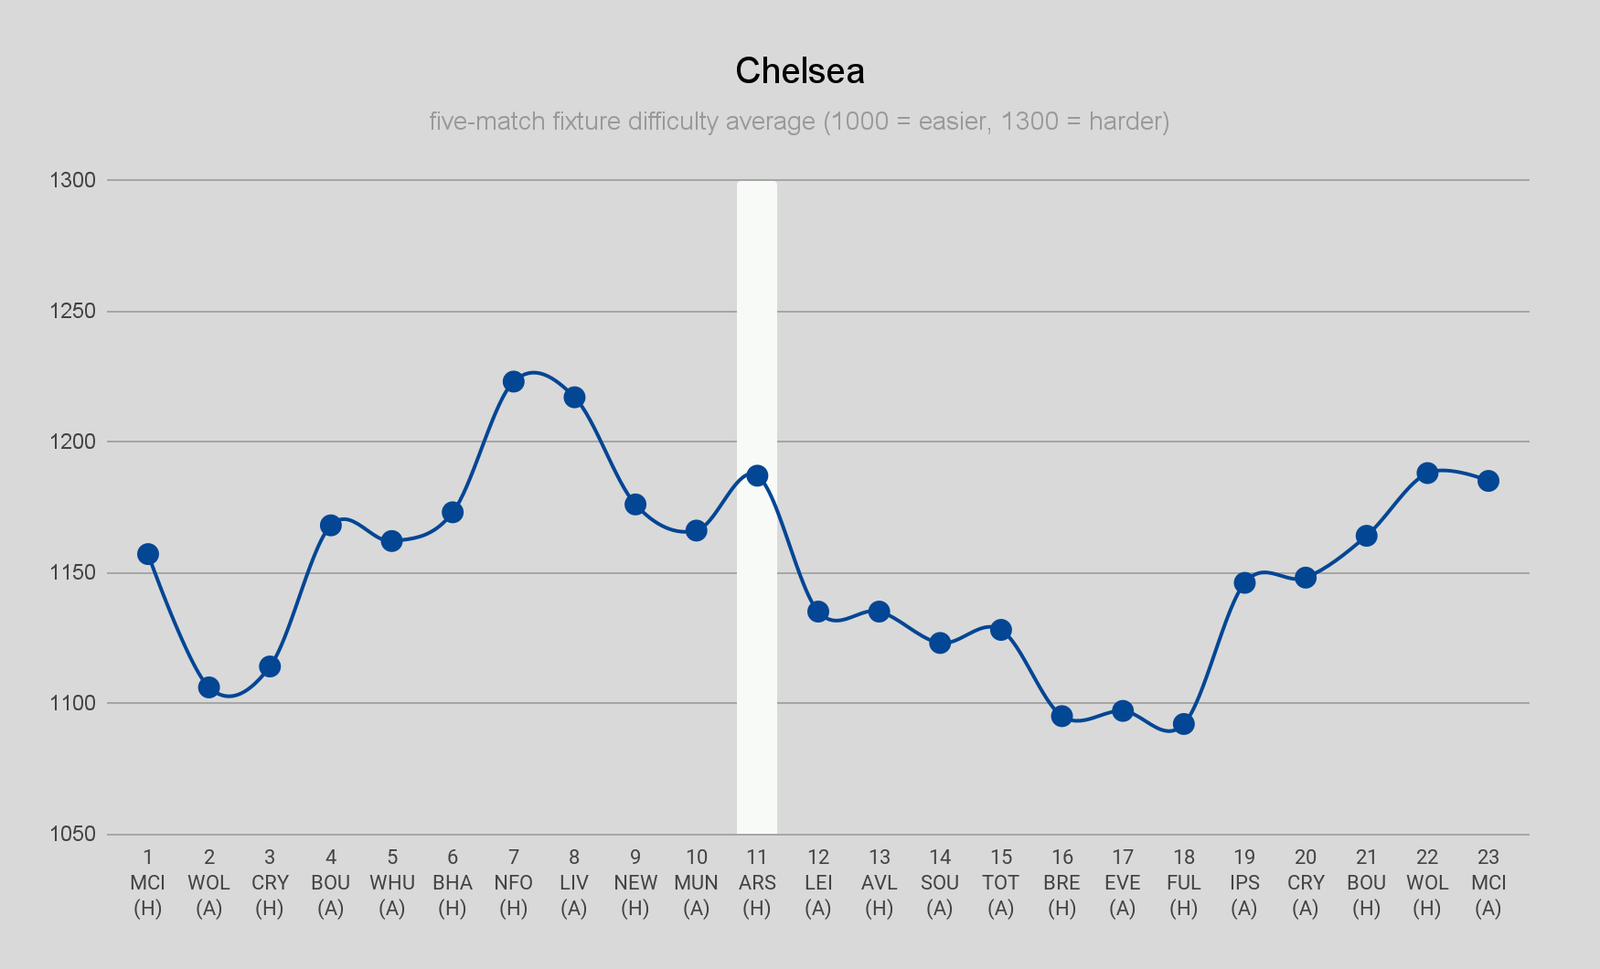
As a complement to this site’s Season Ticker, Fantasy Football Scout Premium Members can now download “Fixture Swing Charts” for each FPL team.
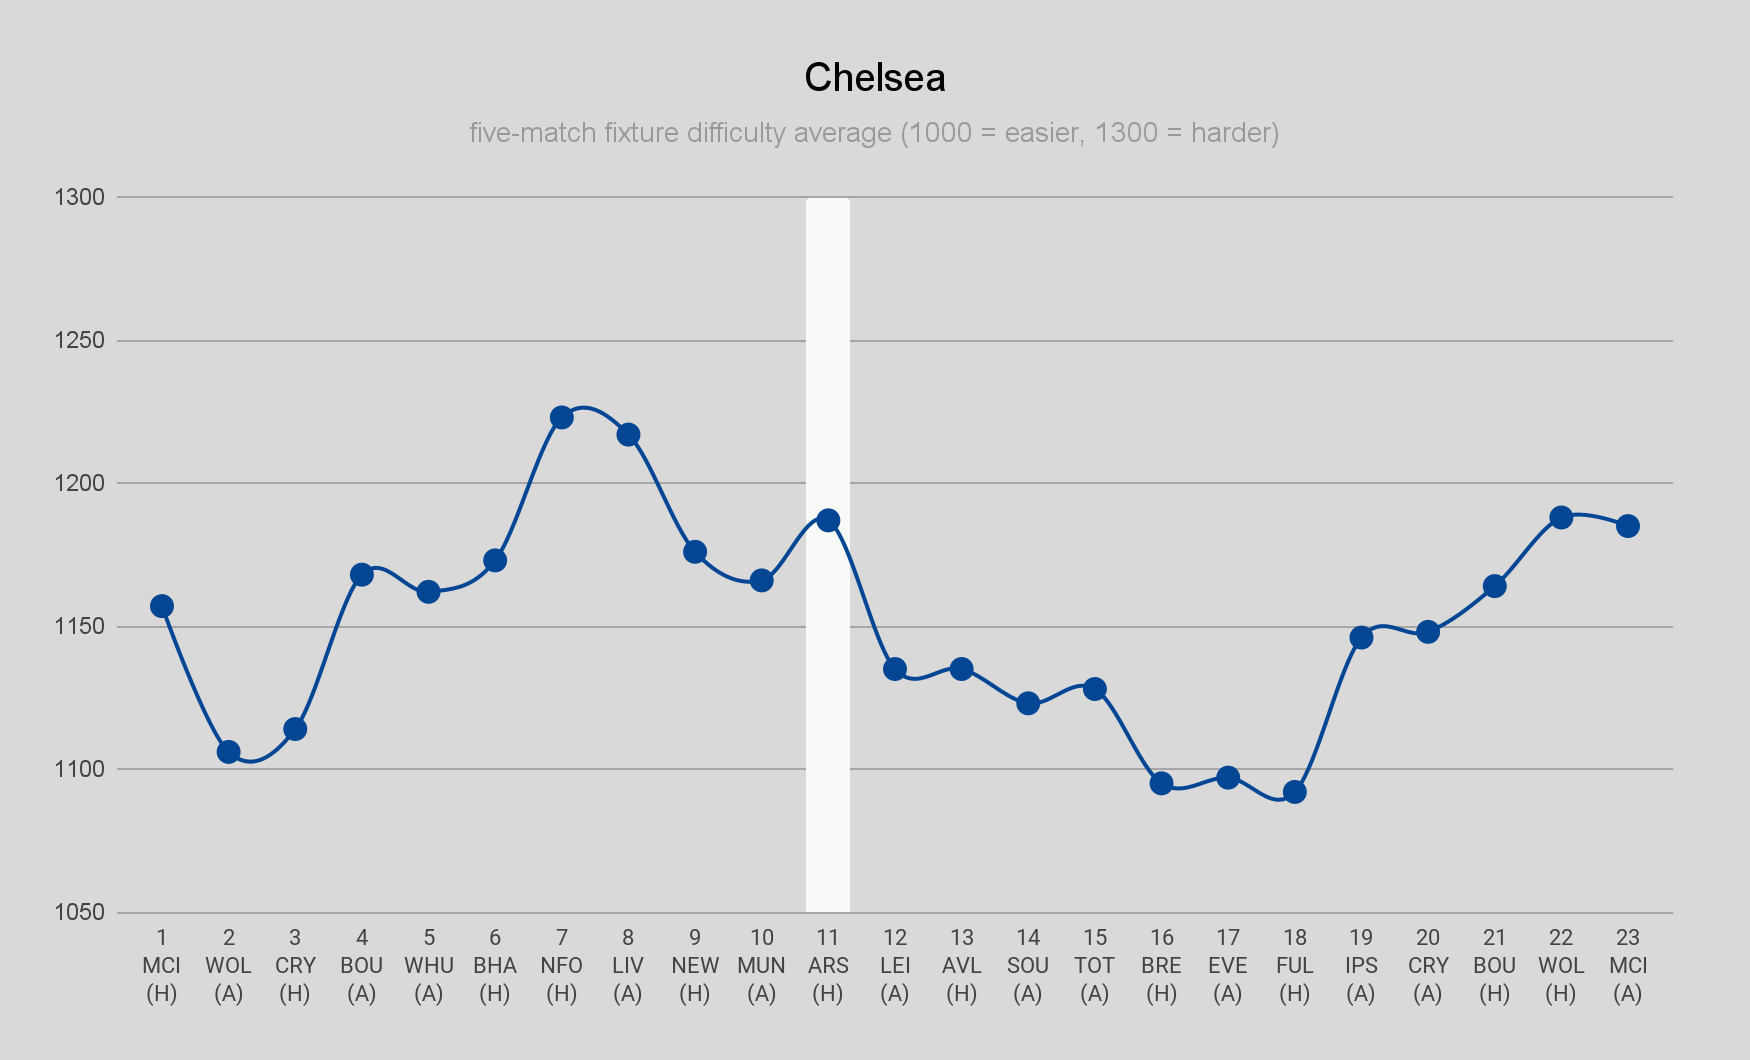
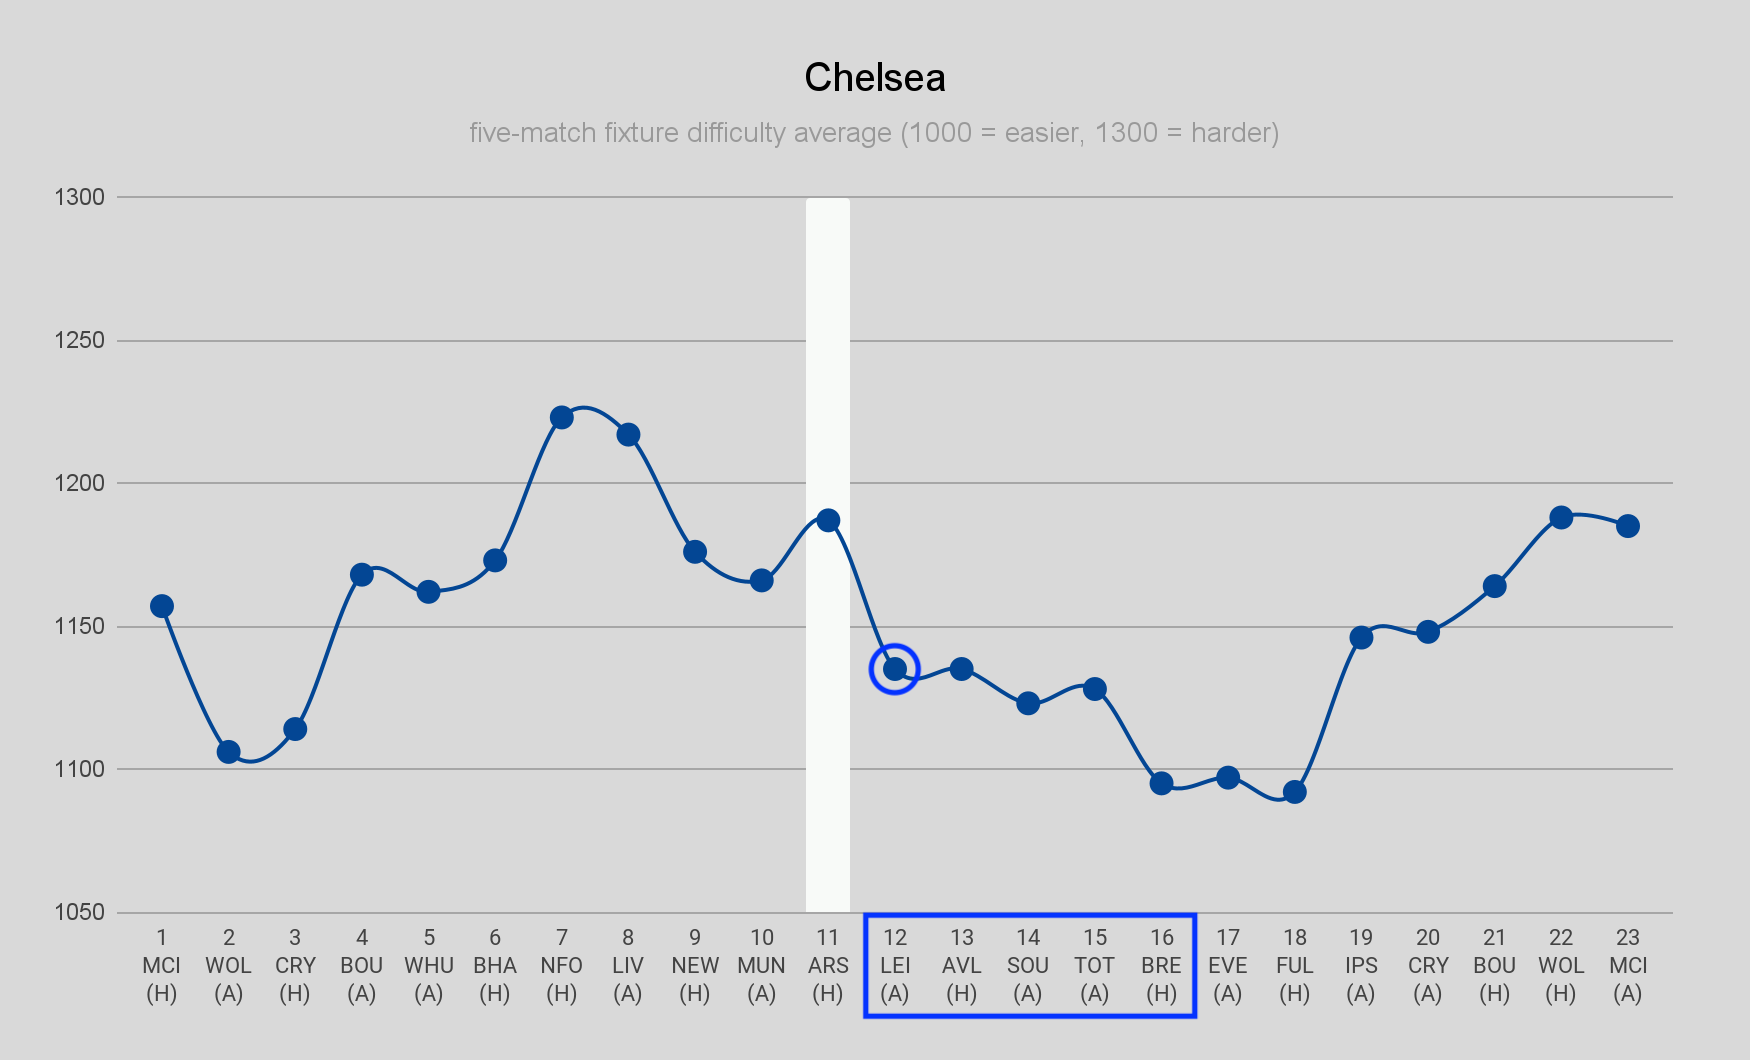
Chelsea’s fixture swing chart, each point represents the average rating of their next five fixtures
The idea behind them is that they make it easy for you to spot upcoming fixture swings at a glance.
The underlying difference between them and the Season Ticker is that each point represents an average rating of the upcoming five fixtures. As opposed to illustrating individual fixtures using colour coding.
As an aid to planning, much like our best fixture runs article, the charts can help you to identify when is a good time to jump on or jump off teams.
Points towards the bottom of the chart indicate a lower average rating – and a good time to get on board – whereas points towards the top indicate a higher average rating, and a good time to sell.
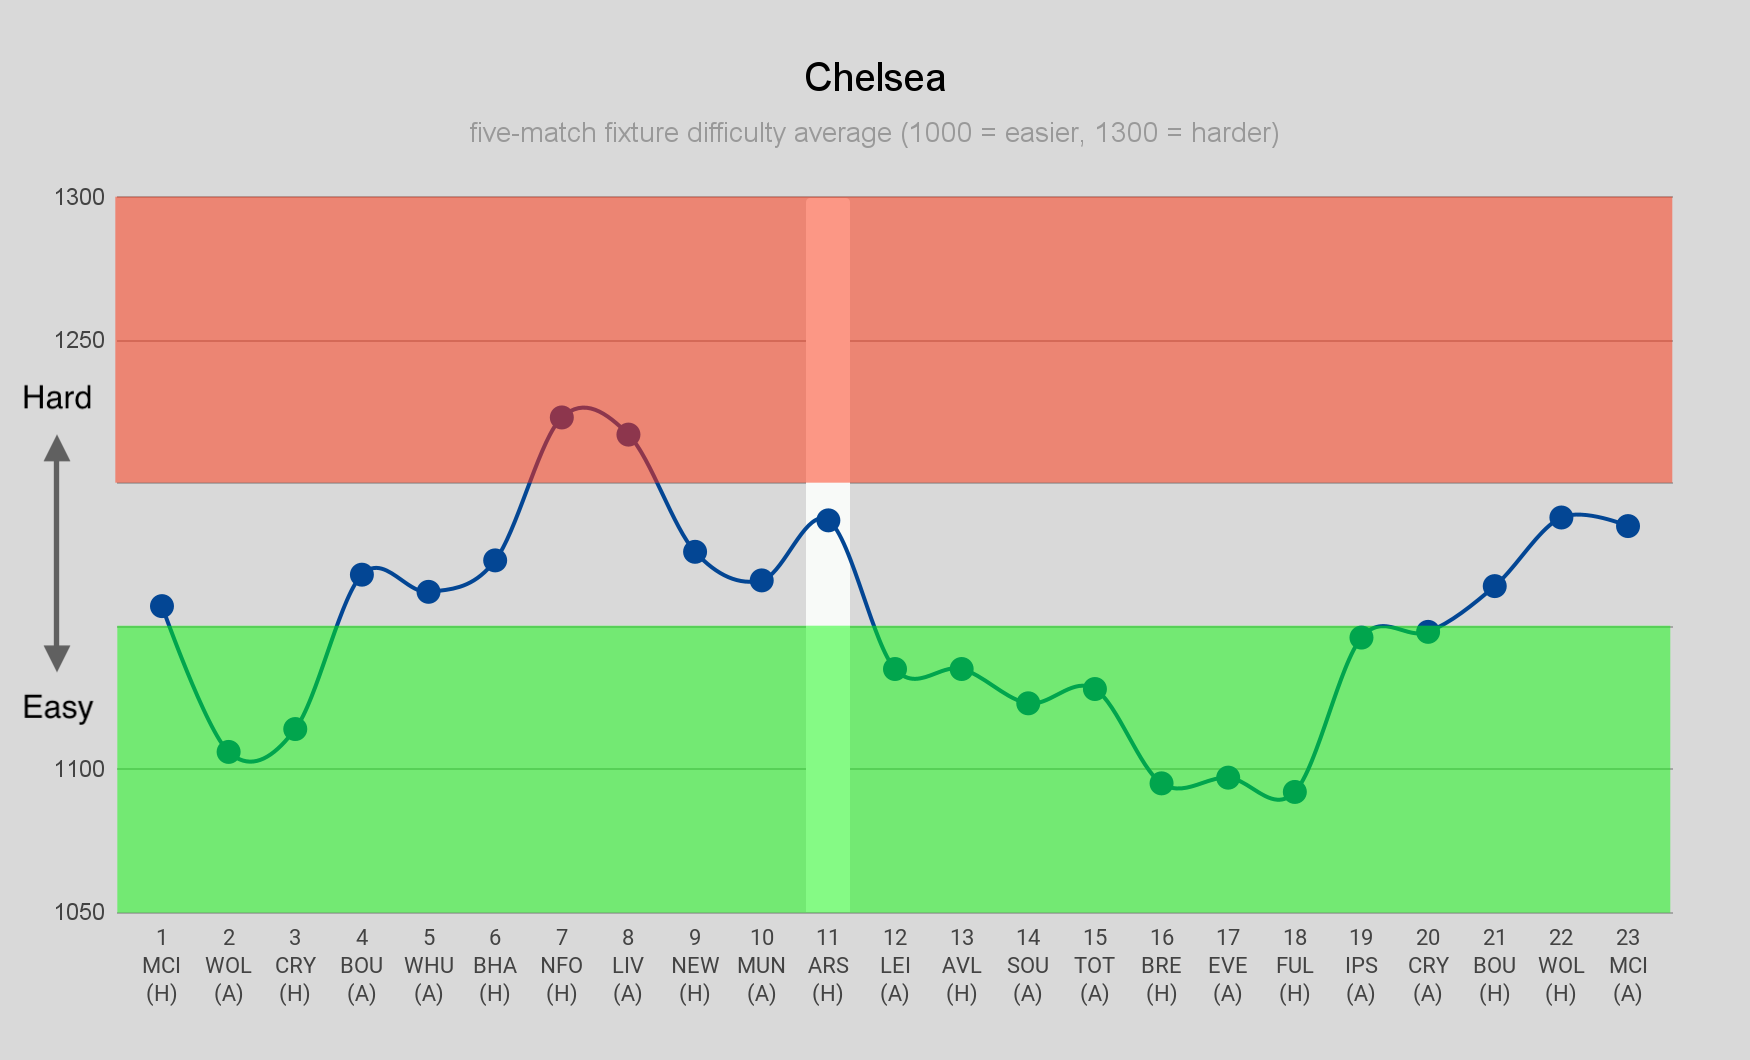
Chelsea’s fixture swing chart, with highlighting added to show good and bad periods
Using Chelsea as an example, the average rating of their next five matches is 1187. Breaking this down: 1350 + 1100 + 1160 + 1065 + 1260 = 5935 / 5 = 1187

Chelsea’s upcoming five fixtures and their difficulty ratings, according to the FFScout Ticker
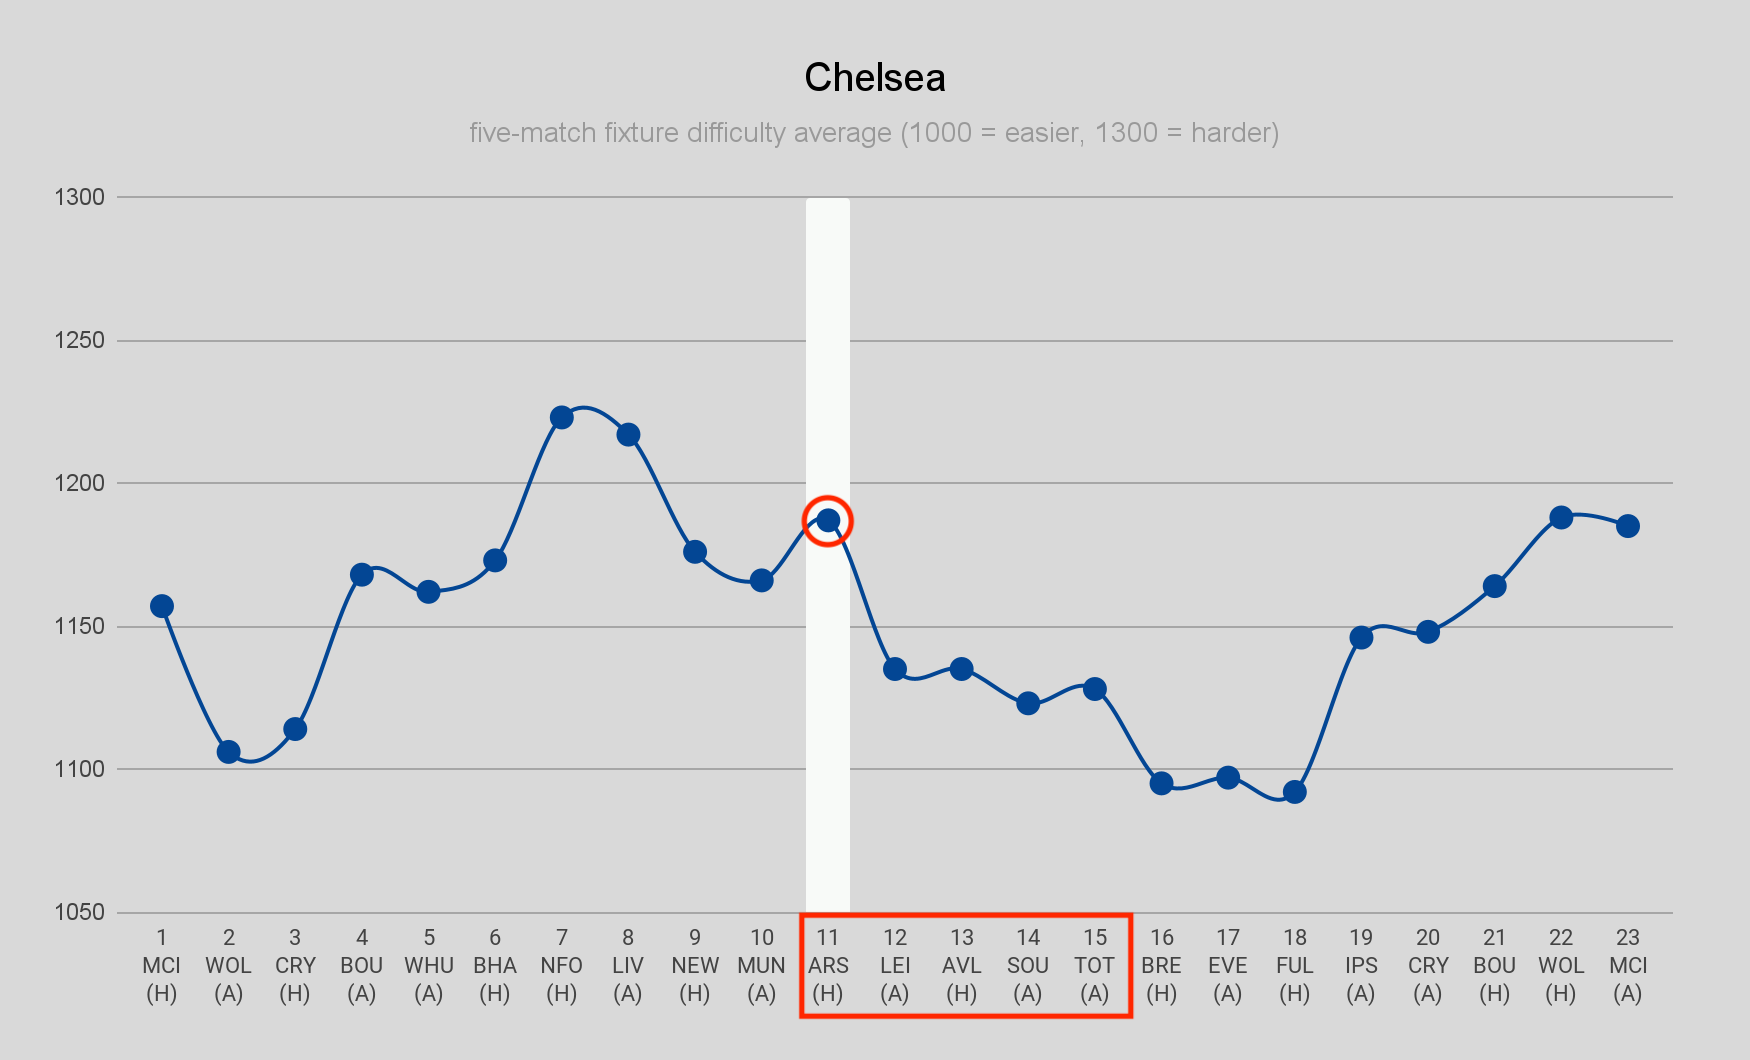
But waiting a Gameweek sees their average rating drop to 1135, with Arsenal replaced by Brentford: 1100 + 1160 + 1065 + 1260 + 1090 = 5675 / 5 = 1135.

Chelsea’s five fixtures from GW12 and their difficulty ratings, according to the FFScout Ticker
Seeing into the Future
Chelsea’s impending fixture swing and good run is fairly evident when looking at the ticker. The Fixture Swing Charts are more useful for highlighting future shifts, allowing you to see ahead in a way that the ticker doesn’t.
Take Fulham, for instance. Their five-match sequence from Gameweek 12 is their hardest run, but by Gameweek 19 their schedule is much improved. Their average rating has dropped from 1230 in Gameweek 12 to 1097.
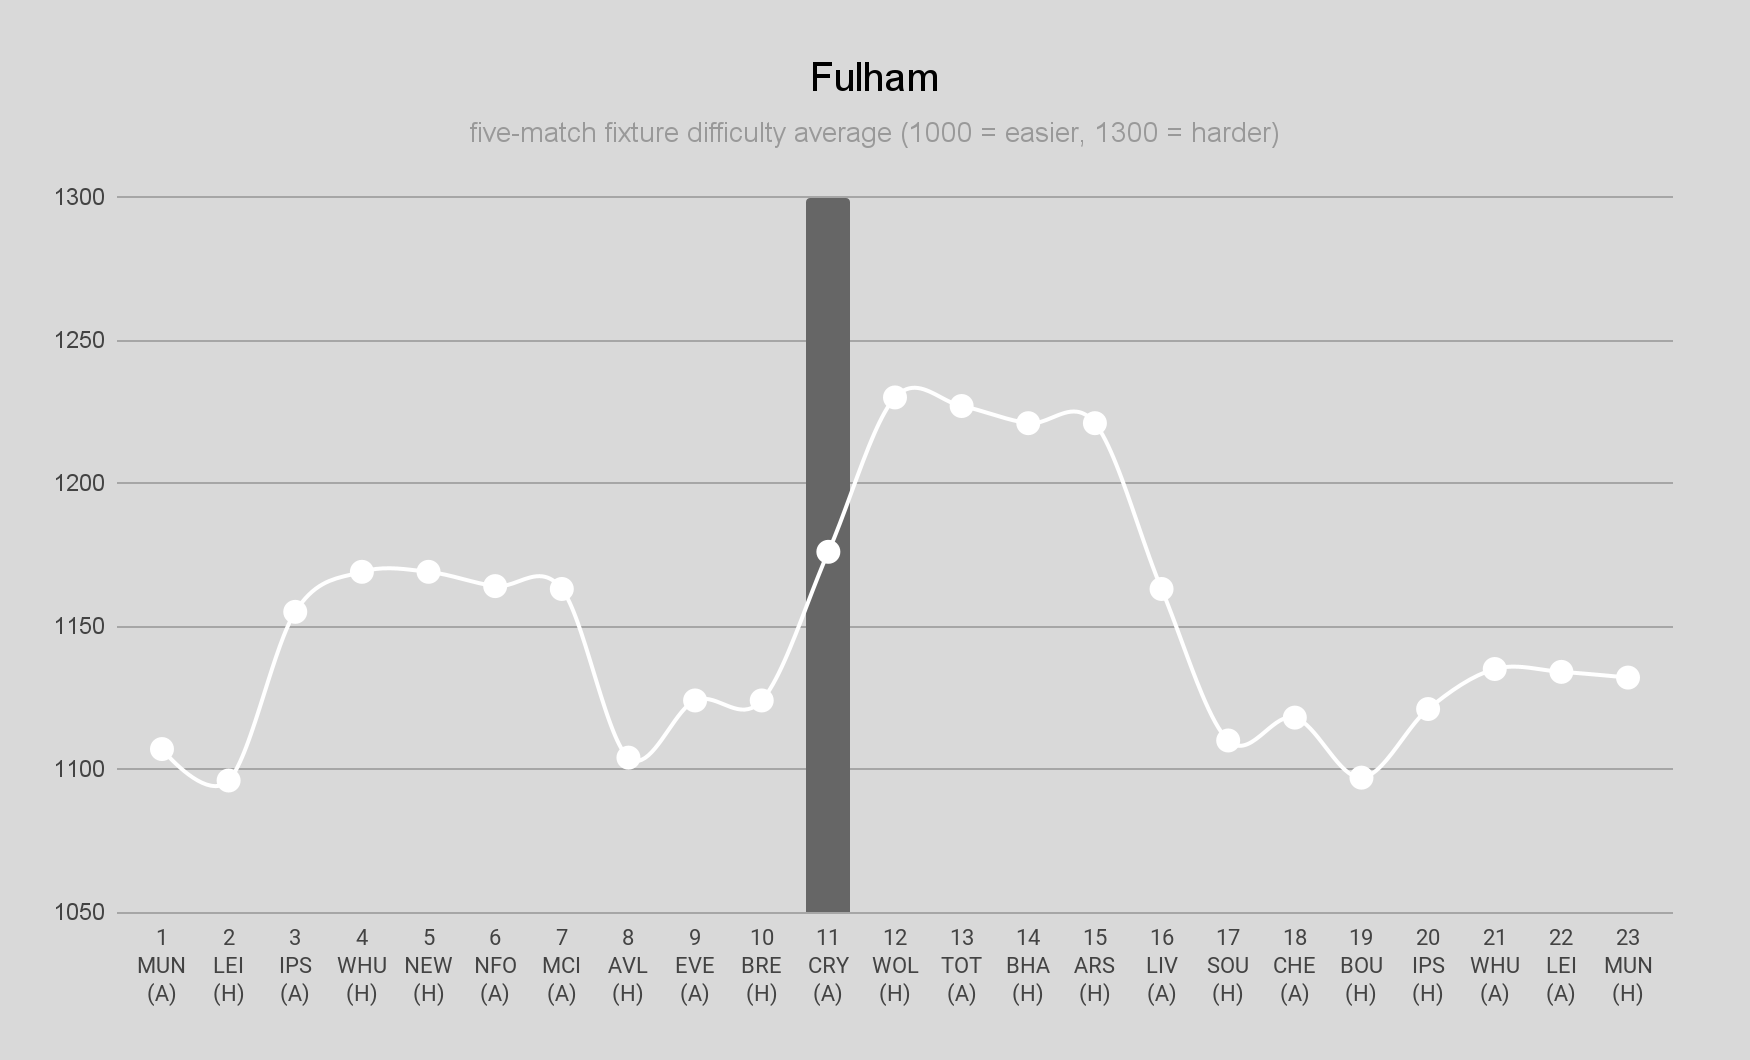
Fulham’s fixture swing chart, each point represents the average rating of their next five fixtures
The charts also reveal dramatic swings, with a steeper gradient alerting you to a rapid change in opponent strength.
Everton’s extended good run is beginning to turn, with their average five-match rating of 1097 in Gameweek 10 rising to 1290 by Gameweek 15. It doesn’t get much trickier than Liverpool, Arsenal, Chelsea, Man City and Nott’m Forest.
So if Dominic Calvert-Lewin (£5.9m) isn’t already on your to-sell list, he will be soon.
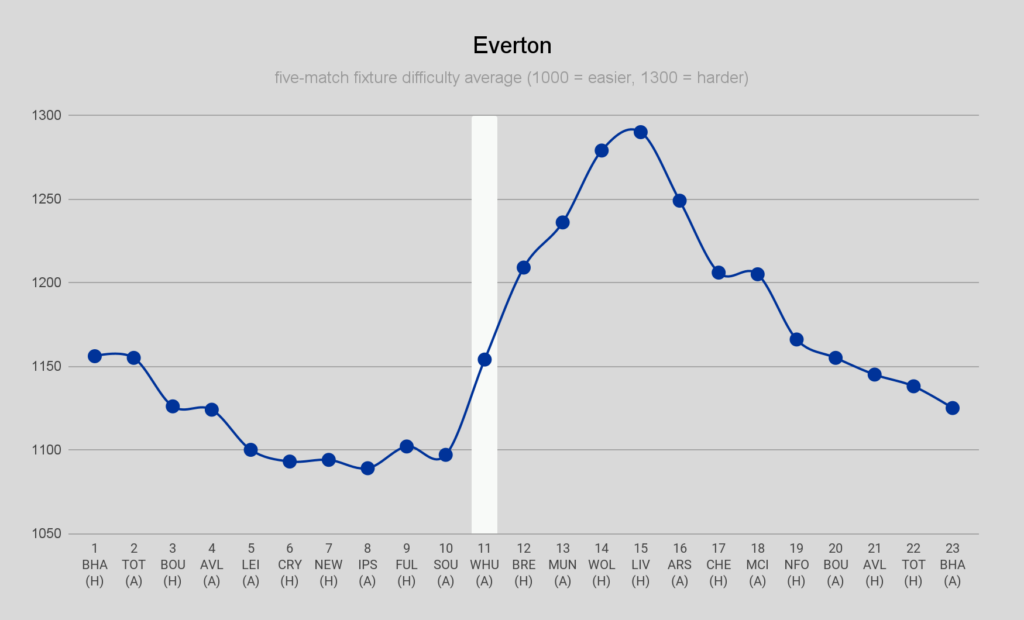
Everton’s fixture swing chart, each point represents the average rating of their next five fixtures
Ménage à Trois
Grouping several teams onto one chart – a functionality not yet available to members (watch this space) – can reveal not only good moments to jump from one team to another but also tricky periods to navigate.
Gameweeks 15 and 16 see the four teams containing the most expensive players in FPL all enter a favourable run of matches. With a “four-mium” set-up featuring Erling Haaland (£15.3m), Mohamed Salah (£12.8m), Cole Palmer (£11.0m) and Bukayo Saka (£10.1m) surely beyond us, we will have some difficult decisions to make about who to leave out.
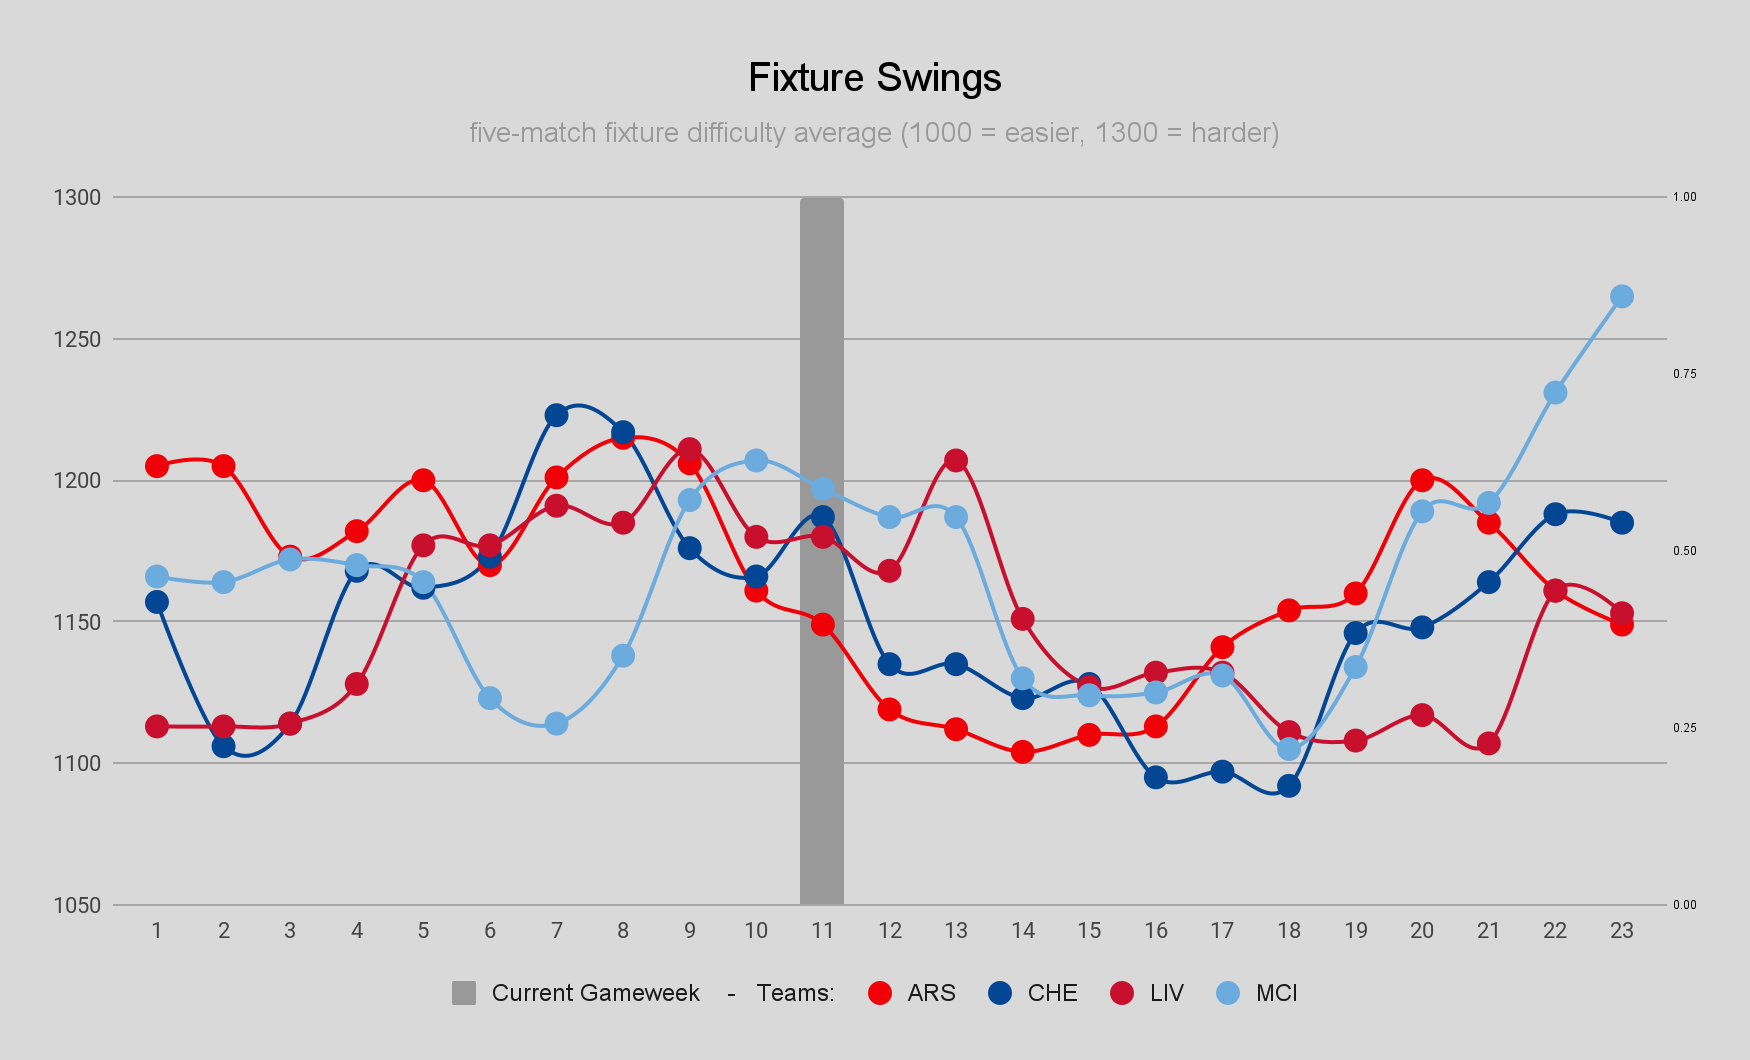
Fixture swing chart including Arsenal, Chelsea, Liverpool and Man City
When thinking about the budget players to help us through that period, a group chart also helps.
Wolves trio Rayan Ait-Nouri (£4.7m), Matheus Cunha (£6.7m) and Jorgen Strand Larsen (£5.6m) are all the rage at the moment as Gary O’Neil’s side embark on a kind run. But when their fixtures begin to stiffen, Southampton offer a cheap alternative to switch to.
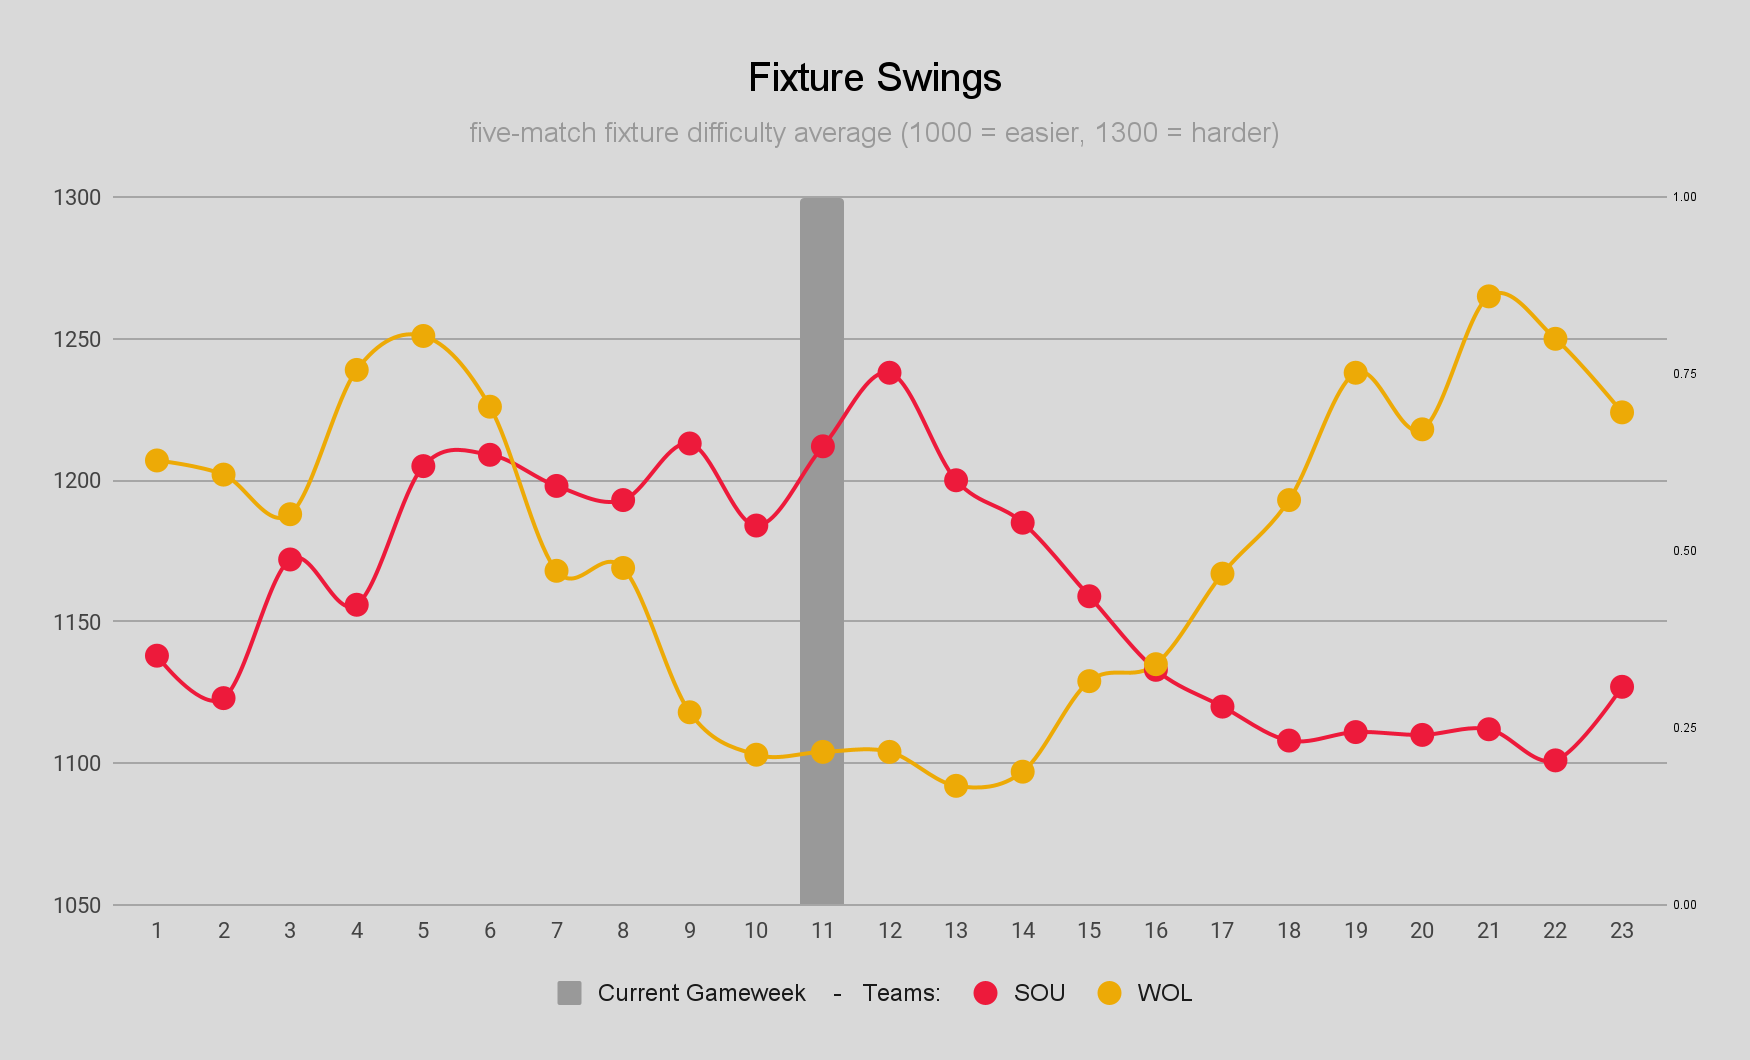
Fixture swing chart featuring Wolves and Southampton
Download the Fixture Swing Charts for each Premier League team using the following link:
The fixture difficulty ratings will likely be updated sometime during the international break. When they are, we’ll post revised versions of the charts.
